Emini Futures Trading Update- 03July2019

spx500-futures-daily-chart-analysis-03july2019

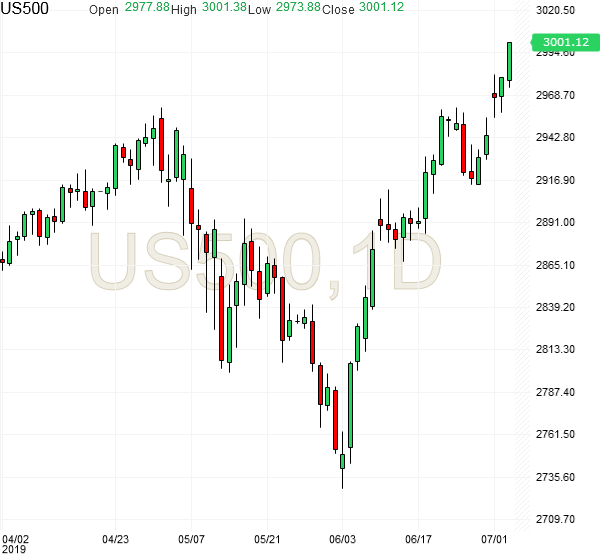
Hello Folks, 3000 is here!!! And this 3000 has been our target for S&P500 futures from 1st Jan 2019, the start of this year, when the futures were at 2530, and 3000 looked so far away, and many traders asked me if this was indeed possible within 2019. All along, every month, I have been reminding our trading group that 3000 is the target, and it was difficult to believe just one month back in May 2019, when the futures were in major correction mode. Well, the target has come in 6 months!! And that too after two rejections at 2950 and major corrections along the way.

We have been positive and constructive all along and always looking to buy on corrections, because the uptrend never broke even once as per my analysis. Some traders regularly asked why we were not going short during market rallies. Well, the answer is in front of you. All time high, 3000 is here. The big money has come on the long trades, and for the Nth time since year 2001, it is the long trades that give reliable income with S&P500.

3000 was looking visible once the futures started trading above 2960. We have been long from 2968, so we are gaining from this upmove. But gains keep coming every month, today is the day to celebrate 3000, our major target getting hit. Thank you S&P500!!

On this lovely day, I want to share my next major target with you.
It is 3600. Timeframe 2 years.

Emini Futures Trading Update- 04Jun2019

spx500-futures-daily-chart-analysis-04june2019

Hello Folks, the S&P500 futures are making a very bullish move after a month long fall in May 2019. Nice to see a lovely green day after many red days! And 2800 level is back! This was given as a target at 2750, and it has come within 48 hours.

#SP500 futures are currently at 2805, well above their 200 day moving average of 2770, so we are back on positive ground again, and from here, the default direction is up. Immediate target 2825, which would be 100 points up from yesterday’s low of 2725, so 20 points upside is clearly visible before any major profit taking comes.

There is an old resistance at 2830, which is also now coinciding with 20 day moving average, so we should expect a pause and correction at 2830. Above 2830, the reliable target is 2850 for June 2019. Other two upside targets for June-July are 2880 and 2910. The original target of 3000 is still intact. So we need to stay long above 2770.

In addition, Nasdaq100 is up 2.2%, or 153 points, reversing its major loss of yesterday, and reversing from a critical support level. That’s a positive sign for the current recovery in S&P500. But the S&P500 futures have to cross 2820-2830, for emerging into fresh upmove till 2880-2900. The 200 day moving average is at 2770, which should provide support on the downside. A retest of 2800 is very likely to create the next upmove above 2830.

Emini Futures Trading Analysis- 20Mar2019

spx500-futures-daily-chart-analysis-20mar2019

sp500-futures-daily-chart-analysis-10sma-20mar2019

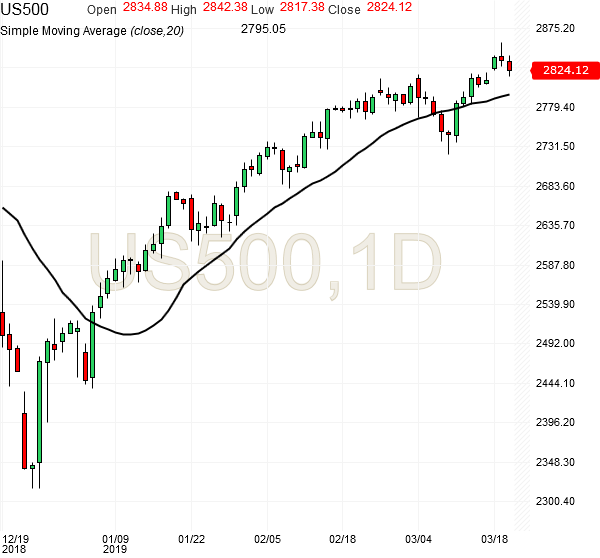
The S&P500 Emini Futures are currently at 2825 after making a high of 2858 yesterday March 19, 2019. And they have started selling off on profit-taking pressures since yesterday and the futures have already corrected almost 40 points from their high of yesterday.

This correction was to be expected in a way because the S&P500 Futures have broken out of a very strong resistance level at 2820-2830 that has been prevailing for last 6 months, since October 2018. The breakout from a long-standing resistance is not easy and the futures have done that this week. Now they are trying to come out of that and test one more time whether the support is actually holding at the 2820 level.

So we should not be excessively worried about the correction that is happening today because this is natural to test the resistance levels that we are crossing and to check whether that resistance level has become a support level, which is what it should become. Continue reading →

Emini Futures Trading Analysis- 10Sep2018

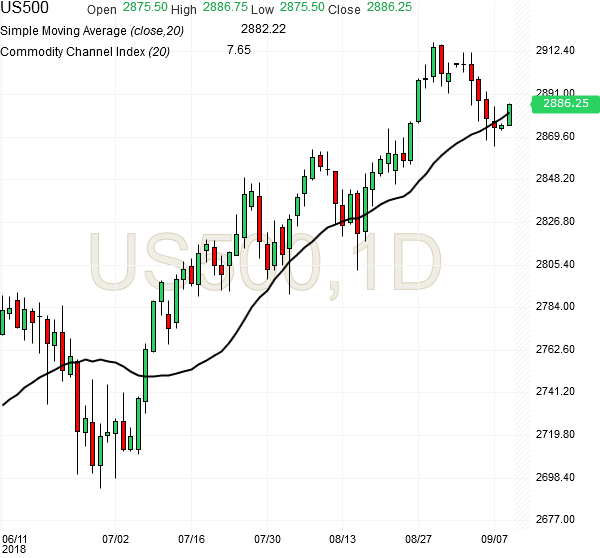
Hello Folks, the S&P500 Emini Futures (ES) are currently at 2885. They have moved back above 2880, which was the breakout level two weeks back, and that’s good news because the futures become safe above 2880.

spx500-futures-daily-chart-analysis-10sep2018

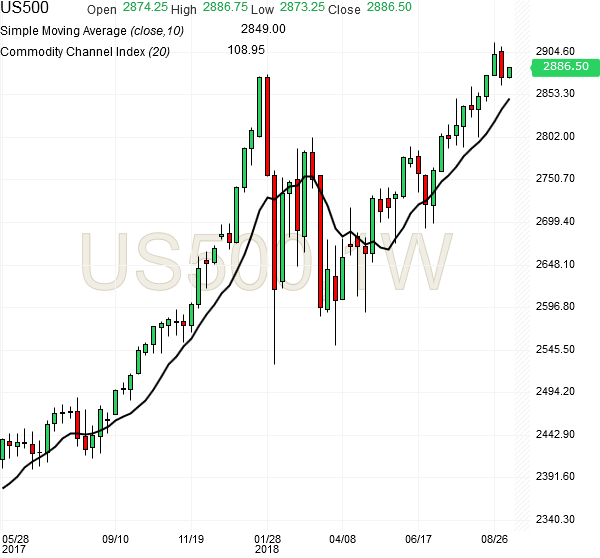
The S&P500 index trend is up, and new long trades can be considered from here onwards, though high reliability long trades will come above 2900. Any long trade at these levels needs 15-20 points stop loss. There is a support at 2850, visible on the weekly charts. However, the major support is at 2800, and any sharp correction will may only stop at 2800-2810 level. So there is some downside in this market, unless bullish moves start asap. Traders must avoid longs below 2880. Today’s moves are looking positive, where the index has come back above its 20 day moving avg.

spx500-futures-weekly-chart-analysis-10sep2018

Our Emini Futures Trading Strategy is to go long above 2880. Upside targets of 2930-2950 are visible now, if 2880 level holds. Below 2880 level, major losses can come rapidly

[Bonus Trade] Buy at 2885 for Target 2900 with Stop loss 2870

Market view: Trade wars and global currency swings are a slippery slope, and sometimes, big negative events have happened in such conditions, so the market is right in being cautious, because the investors are taking risk at current higher-end market valuations and betting on stable economic conditions.

Most large corrections have been in the fall, when the chill winds of the fall season, erase the holiday cheer of the summer, and people are forced to look at the things in a clear way. So we should be careful in September and October. If these two months go without major damage, then we may see new highs on S&P500 by year end in Dec 2018. Thanks.

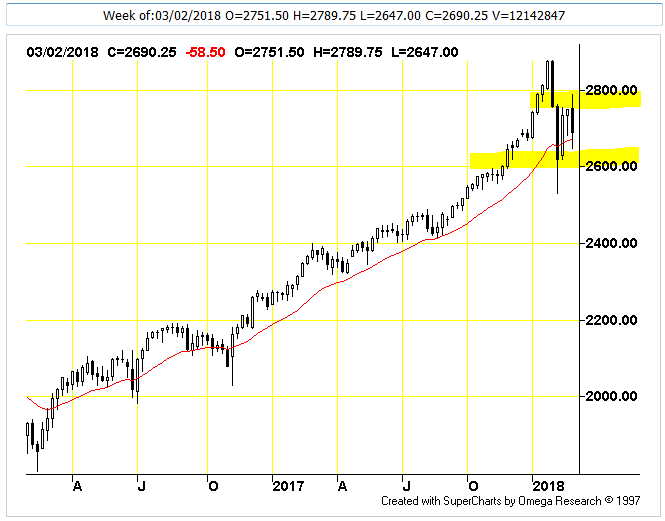
Emini Futures Trading Analysis- 02Mar2018

spx500-futures-weekly-chart-analysis-02mar2018

The futures have bounced back from 2650 this week, and closed above 2673, which is the 20 week SMA. There is clear resistance at 2780 level. The futures are testing lower level support levels of 2600-2650 and recovering from those levels, which is a positive sign. The S&P500 Emini Futures have shown support at 2650 and resistance at 2780 – that’s the trading range for coming week. Many technical indicators are saying that this fall is over, and the market will now prepare for the next upmove towards new highs of 2900-2950 in the coming weeks/months. However, 2600-2650 maybe retested and 2500 can also come if 2600 breaks down. Therefore, any major long positions should be created above 2700 with 2680 as stop loss.

[Bonus Trade] Buy S&P500 Emini Futures at 2670 for Target 2710 with Stop loss 2650.
That’s 40 points gain with 20 point stop loss.

S&500 Futures Weekly Chart – Technical Analysis
Date: Friday, March 02, 2018

Moving Average Indicator: Price is above the moving average so the trend is up. In the short term, the market is bearish because the fast moving average is below the slow moving average. Even though based on conventional interpretation the market is technically bearish, we will not classify it as extremely bearish until the following occurs: the slow moving average slope is down from previous bar. In the long term, the market is bullish because the fast moving average is above the slow moving average. Even though based on conventional interpretation the market is technically bullish, we will not classify it as extremely bullish until the following occurs: price goes above the fast moving average, price goes above the slow moving average.

Bollinger Bands Indicator: The Bollinger Bands are indicating an oversold condition. An oversold reading occurs when the close is nearer to the bottom band than the top band. Volatility appears to be declining, as evidenced by a decreasing distance between the upper and lower bands over the last few bars. The market appears oversold, but may continue to become more oversold before reversing. Look for some price strength before taking any bullish positions based on this indicator.

Commodity Channel Index (CCI) Indicator: CCI (33) is in neutral territory. A signal is generated only when the CCI crosses above or below the neutral center region. CCI often misses the early part of a new move because of the large amount of time spent out of the market in the neutral region. Initiating signals when CCI crosses zero, rather than waiting for CCI to cross out of the neutral region can often help overcome this. Given this interpretation, CCI (33) is bullish, but has begun showing some weakness. Begin looking for an attractive point to liquidate long positions and return to the sidelines.

RSI Indicator: RSI (54) is in neutral territory. This indicator issues buy signals when the RSI line dips below the bottom line into the oversold zone; a sell signal is generated when the RSI rises above the top line into the overbought zone. RSI is somewhat overbought (RSI is at 54). However, this by itself isn’t a strong enough indication to signal a trade. Look for additional evidence before getting too bearish here.

MACD Indicator: MACD is in bearish territory, but has not issued a signal here. MACD generates a signal when the FastMA crosses above or below the SlowMA. The long term trend, based on a 45 bar moving average, is UP. The short term trend, based on a 9 bar moving average, is DOWN. MACD is in bearish territory.

Slow Stochastic Indicator: The stochastic is bearish because the SlowK line is below the SlowD line. The long term trend is UP. A good upward move is possible without SlowK being overbought. However, a down move in SlowK for this bar is a little concerning short term.

Disclaimer: The above analysis is meant solely for the understanding of technical analysis of the S&P500 index futures. It is not meant to provide any investment advice.