Emini Futures Trading Analysis- 13Nov2019

The S&P500 Futures are currently at 3094.
They have been testing the support at 3080 level for last 5 days.
The futures went down today again till 3075 and bounced back to 3090.

The futures have defended 3070 level 3 times in last one week.
So the support is between 3070-3080 level.
And 3070 should be the stop loss on all long trades, even on intraday basis.

Our Emini Futures Trading Strategy is to stay long above 3070.
The target for the next upmove is 3125. We will increase long positions above 3100.

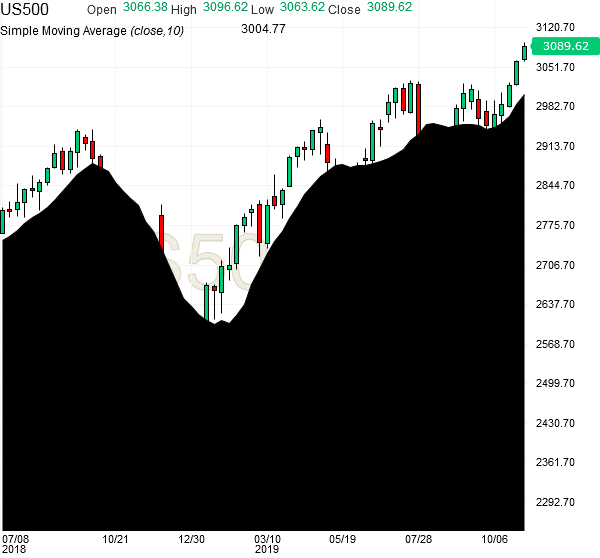
The following daily chart of the S&P500 futures shows how the recent upmove has been carrying forward smoothly above the 10 day SMA (simple moving avg). Therefore, a closing below the 10 day SMA, which is currently at 3077 is the stop loss for all long trades.

spx500-futures-daily-chart-analysis-13nov2019

Once 10 day SMA breaks, the futures can move down rapidly to test 3000-3010 level.
Below 3070, the next major support is 3000, which becomes the target for the downside.

Here are two tactical trades that can be done by active and alert traders.
[Bonus Trade#1] Buy at 3090 for Target 3120 with Stop loss 3075.
[Bonus Trade#2] Sell at 3070 for Target 3040 with Stop loss 3085.

Emini Futures Trading Analysis- 07Nov2019

The S&P500 Futures are currently at 3090, and they have been moving up steadily since Oct 10th, 2019 after they closed above their 10 day simple moving avg (SMA), and they have not broken their 10 day SMA yet, despite frequent ups and downs on day to day basis. Four weeks have passed already, making this one of the longest duration of steady upmove by the S&P500 futures in the last two years.

Traders can stay long with 10 day SMA as the Stop loss. It is currently at 3055, which is about 35 points below market price. Below the 10 day SMA, no fresh long trade should be attempted, because the futures can easily go and hit 3000 level again. Traders need to be very alert in the current market and trading positions must be kept light.

spx500-futures-daily-chart-analysis-07nov2019

Following the latest chart at the close of today. The futures have made a bearish candlestick pattern today, after losing most of the gains of today, to the inevitable profit taking at these all time high levels.

spx500-futures-daily-chart-analysis2-07nov2019

Following is the weekly chart with area-plot of the 10 week simple moving average. There should be no long trades in the black area, because that is the zone of high volatility and sharp cuts.

spx500-futures-weekly-chart-analysis-07nov2019

Once 10 day SMA breaks, the futures can move down rapidly to test 3000-3010.
Below 3050, the next major support is 2980, which becomes the target for the downside.

Here is a tactical trade that can be done by alert and nimble traders.
[Bonus Trade] Sell at 3040 for Target 3010 with Stop loss 3060.

Emini Futures Trading Analysis- 11Oct2019

Hello Folks, the S&P500 futures are currently at 2978.00
Today’s Range: 2941.25 – 2993.00

The futures have made a big move today after creating a good base in the last two days. Today’s upmove is looking reliable coming on the back of a very good setup made in the last 2 days. But we have a weekend coming up, which has a tendency to create gap-ups and gap-downs by Monday morning, so I am analyzing our next long trade here.

spx500-futures-daily-chart-analysis-11oct2019

Please Note: There is a major resistance currently at 2976.
We need daily closing above 2880 for clean upmove to 3020-3030 level.
That will be a reliable long trade.

spx500-futures-5hr-chart-analysis-11oct2019

Our S&P500 Trading Strategy has been to stay long and buy all corrections above 2850 level, and that has given good gains in the last 3 months.

[Bonus Trade]
Buy at 3000, for Target 3023, with Stop loss 2980″.

Market Notes:

  • The futures were volatile in the early part of this week and on 8th Oct 2019, the futures suddenly dipped below 2890 from 2920-2930 levels in pre- market around midnight UK time, thereby taking out the stops of most traders in the market, and then bounced back to 2920 levels before market open.
  • We were in the market at night on 8th Oct, and saw this live, and quickly bought futures at 2885-2890 levels with 2850 Stop loss, and were able to sell them after 5 hours at 2920-2925 levels, all of this in pre-market trading! But those are high speed, dynamic trades with 50-50 chance of success, which can’t be used as General Trades for all traders based in different locations and time zones.
  • Our larger traders who do Optional Trades with 1-2 contracts (and General Trades with with full volume of Emini contracts), could use our default trade at 2900 once again this week. Our default trade since Aug 2019 has been: “Buy at 2900 for target 2930 with Stop 2880”.

Next Steps: Today is looking a clear case of S&P500 Breakout Trading. There is no immediate trade as of now, but please stay alert because a new trade may come if 2880 is crossed successfully today on closing basis. Thanks!

End of Day Update: The futures went up till 2993 and were trading above 2980 most of the day, but could not close above the major resistance of 2976! This creates fresh downside possibility of retest of 2950 next week, but the upside target of 3000+ can also come in the next 1-2 weeks. So we should aim to buy the corrections with a stop loss of 2930. Its good that we did not buy at 2985-2990 levels during the day otherwise our stop loss would have got hit by end of day. Now we just have to select a fresh entry point for taking a long position next week.

Following is the weekly chart of the S&P500 futures. The last two weeks have shown strong defense of lower levels below 2900 and it has set up the stage for testing 3000-3050 levels. Thanks.

spx500-futures-weekly-chart-analysis-11oct2019

Emini Futures Trading Analysis- 10Sep2019

Hello Folks, the S&P500 Emini futures are at 2973 currently, and they have been consolidating after their breakout above 2940, which was a key resistance level. So we will surely see further upmove in coming days. Traders should stay long above 2940 for Target 3000 and 3015. We should see at least one testing of 3000 level in Sep 2019.

spx500-futures-daily-chart-analysis-10sep2019

Update, 11Sep2019: As expected and mentioned above, the S&P500 Emini futures have hit 3000 within this September month, on Sep 11, 2019, and within 30 hours of this post on Sep10, 2019. More upside is possible based on supportive macro data and US Fed announcements. There is a strong resistance at 3030, which needs to be crossed for next leg of upmove to 3070-3080. Thanks.

Emini Futures Trading Analysis- 05Sep2019

Hello Folks, the S&P500 futures are currently at 2980.00
The futures have finally broken out of their month long range today!
The day high so far is 2986. They may retest 2973 during the day.

Our standing trade has been to buy at 2900 for target 2930 with stop 2800.
This trade triggered once again earlier this week, and also closed
successfully, giving 30 points gains in that default/standing trade, which we will take as Trade#1 of Sep2019.

The trend is clearly up after the latest breakout today, and our Emini Futures Trading Strategy for Sep 2019 is to stay long above 2950. There is a good chance of hitting 3000 by end September, as a result of the successful breakout. So we will aim to take up another long trade above 2970 for target 3000. The exact trade has been sent out to the Trading Group.

Please Note: Unless otherwise stated, all trades are with 5 Micros, or half Emini contract. This size looks good for capturing the market opportunities with enough gains, while reducing market risk per position into half compared to the Emini futures contract. Thanks.