Emini Futures Trading Analysis- 20Mar2019

spx500-futures-daily-chart-analysis-20mar2019

sp500-futures-daily-chart-analysis-10sma-20mar2019

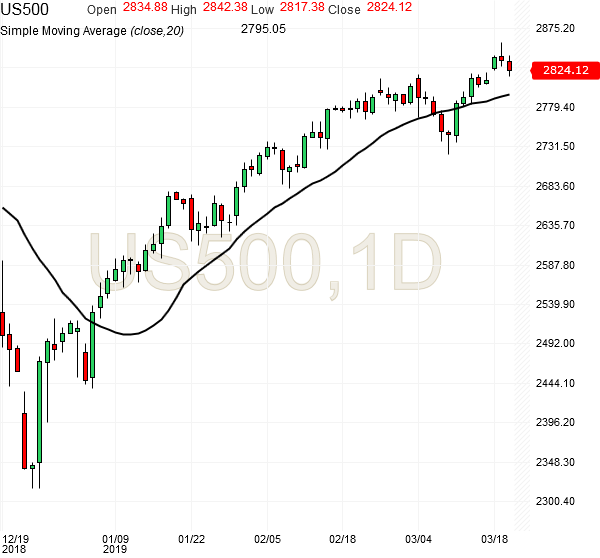
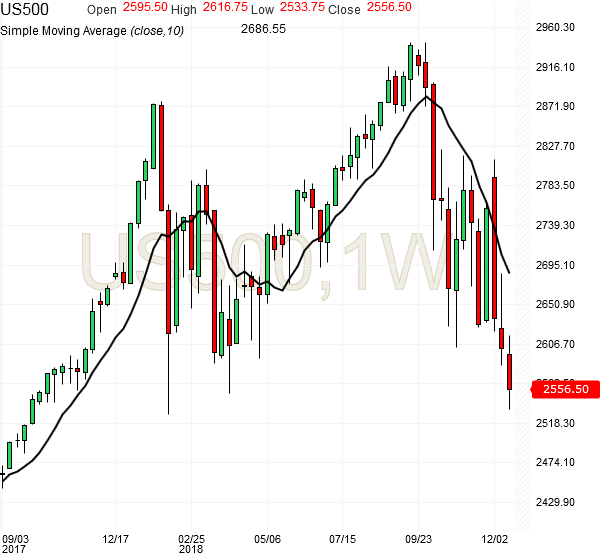
The S&P500 Emini Futures are currently at 2825 after making a high of 2858 yesterday March 19, 2019. And they have started selling off on profit-taking pressures since yesterday and the futures have already corrected almost 40 points from their high of yesterday.

This correction was to be expected in a way because the S&P500 Futures have broken out of a very strong resistance level at 2820-2830 that has been prevailing for last 6 months, since October 2018. The breakout from a long-standing resistance is not easy and the futures have done that this week. Now they are trying to come out of that and test one more time whether the support is actually holding at the 2820 level.

So we should not be excessively worried about the correction that is happening today because this is natural to test the resistance levels that we are crossing and to check whether that resistance level has become a support level, which is what it should become. Continue reading →

Emini Futures Trading Update- 24Dec2018

Hello Folks, the S&P500 futures are at currently 2354. I am confident 2500 will come either by 31 Dec or by first week of Jan 2019, because 2500 is a strong support level, which will break only after testing. 2400 is also a strong support level, and it may come any day. We don’t have any general trades currently because of high volatility. However, we have Optional trades for those traders who want to take much higher risk for a high reward. The following bonus trade is only for traders with some experience and adequate capital. Our Emini Futures Trading Strategy is to buy this sharp correction with stop loss and aim for gains of 50-150 points gain per trade.

[Bonus Trade] Buy at 2350 for target 2500 with Stop loss 2300.

All this correction in Dec 2018 creates an good opportunity for Q1, 2019.
Wishing you Merry Christmas and Happy New Year!

Emini Futures Trading Analysis- 21Dec2018

sp500-futures-dailly-chart-analysis-21dec2018

sp500-futures-dailly-chart-analysis-21dec2018-2436

sp500-futures-dailly-chart-analysis-21dec2018-2426

The S&P500 futures are at 2426, now 200+ points below their 20 day SMA (simple moving average) of 2641. I don’t remember the last time there was so much divergence! It is not sustainable and very clearly, the futures are deeply oversold. There is an element of shorting and an element of long unwinding in this recent correction in Dec 2018. The S&P500 has lost 375+ points from the start of December – its a record. I think its the worst December for S&P500 since 1929. The market is acting as if we have a recession next year, but its not the case. However, this kind of selling may force the US Fed to think twice about their futures interest rate hikes in 2019.

Our S&P500 futures trading strategy is to keep buying at levels below 2500 for target of 2600 in Jan 2019, because 2500 is a strong support, and the futures will rapidly move up to 2500 from any level below 2500. The minimum pullback target is 2600, within 2 weeks. 2650 is also possible once during Jan 2019.

[Bonus Trade] Buy at 2420 for target 2500 with Stop loss 2380.
Current price is 2415.


Emini Futures Trading Analysis- 17Dec2018

Hello Folks, the S&P500 Emini futures are currently at 2555.50, down 50 points for the day. Following are three weekly charts taken at different points of the day today. This is the third red week, and the selling looks mostly done. The futures have tested lower support level of 2530 today, and the futures bounced back from 2530 level, which was the support level established in Feb 2018. The futures are oversold currently, and we can see a good recovery of 100 points to 2650 by December end.

sp500-futures-weekly-chart-analysis-17dec2018

sp500-futures-weekly-chart-analysis-17dec2018-2sp500-futures-weekly-chart-analysis-17dec2018-3

There is a fear in the market that the US Fed will give hawkish message for interest rates in 2019, but I am not sure about that, given the data points about global economic growth slowing down in parts, and crude oil is reflecting those data points. But that fear and the correction seems overdone for now. Investors should expect recovery in S&P500 over next 2-3 weeks.

[Bonus Trade] In my view, the S&P500 will retest its 200 day moving average at 2765 before end-Jan 2019. That is 200 points above the current price of 2555, which presents a good upside for both traders and investors.

Emini Futures Trading Analysis- 02Nov2018

Hello Folks, the S&P500 Emini futures are at 2711.75
Today’s Range: 2699.75 – 2765.75

spx500-futures-minute-chart-analysis2-02nov2018

The futures have dipped below 2700 till 2699.75 in a slow manner, and bounced back sharply from there, indicating that the 2700 support level is holding. Therefore, we will get back our futures lost in the Optional trade of today.

Traders with 10+ contracts: Here’s next Optional trade with 2-3 contracts.
“Buy at 2710 for Target 2745 with Stop loss 2690”

There is no General Trade – the volatility is back, and giving some joy to VIX traders. But we need 2700-2710 levels to get tested again, which will happen today and over the weekend. We may get a suitable setup on Monday. However, if the futures go down to 2680 today, then it will become a good buying opportunity. Please stay alert till market close today. Thanks.

—————————————————————————————–

Hello Folks, the S&P500 Emini futures are at 2713.00
Today’s Range: 2611.75 – 2765.75

We had said on 30th Oct, when the futures were at 2680 that 2750 is a reliable upside target for Nov 2018. And the futures have hit 2750 today itself, which is 2nd Nov. But the futures have corrected sharply after hitting 2766 high today, with 50 points intraday correction, which looks bearish as of now just for the next 1-2 days. The futures have also reacted down from their 200 day SMA, which is not positive, because the goal was to cross the 200 day SMA without major hurdles. The upside trend has appeared firmly in weekly charts, so we need a position to go long, and current position is 50-50, hence not suitable for a general trade.

Traders with 10+ contracts: Here’s an Optional trade with 2-3 contracts.
“Buy at 2715 for Target 2745 with Stop loss 2700”

The support level is strongly in place at 2700, so we may try to take a trade using that support level.
If the futures can hold the 2700 support level, then this is the point of highest risk reward with upside target of 2750 again next week.

[Bonus Trade] This can be done by traders having 1-2 contracts.
“Buy at 2705 for Target 2730 with Stop loss 2690”

spx500-futures-daily-chart-analysis2-02nov2018

spx500-futures-daily-chart-analysis1-02nov2018

spx500-futures-weekly-chart-analysis-02nov2018