Emini Futures Trading Analysis- 06May2019

Hello Folks, the S&P500 Emini futures are at 2901.50
Today’s Range: 2983.75 – 2916.50

Nobody likes weekend volatility, but it’s here today morning!
The S&P500 futures fell sharply on Sunday night after US President
Donald Trump shocked investors by threatening to hike tariffs on $200
billion worth of Chinese goods, raising fears of a global slowdown and
halting a relative period of calm in the markets. The S&P500 futures fell
about 60 points overnight after the Wall Street Journal reported that
China may cancel a round of US talks this week after Trump’s comments.

In other words, volatility is back! And we can benefit from it by getting
a suitable entry point. The S&P500 is still in uptrend, and the target of
3000 is intact. Most stop losses would have hit by 2900 level. Today’s low
of 2883 is the level to watch, so the key support level currently is near
2880.

2990 level may get tested once more before futures move up and
test higher levels of 2920 level. This trade is based on that move. And we
have a stop loss 2880, given to us by market action today morning.

[Bonus Trade] Buy at 2880 for Target 2900 with Stop loss 2860.
Trade update: This trade hit target within the same day.
Emini Futures Trading Analysis- 20Mar2019

spx500-futures-daily-chart-analysis-20mar2019

sp500-futures-daily-chart-analysis-10sma-20mar2019

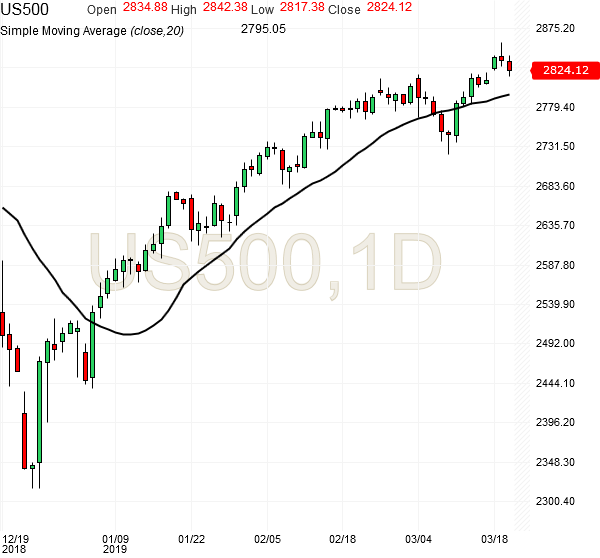
The S&P500 Emini Futures are currently at 2825 after making a high of 2858 yesterday March 19, 2019. And they have started selling off on profit-taking pressures since yesterday and the futures have already corrected almost 40 points from their high of yesterday.

This correction was to be expected in a way because the S&P500 Futures have broken out of a very strong resistance level at 2820-2830 that has been prevailing for last 6 months, since October 2018. The breakout from a long-standing resistance is not easy and the futures have done that this week. Now they are trying to come out of that and test one more time whether the support is actually holding at the 2820 level.

So we should not be excessively worried about the correction that is happening today because this is natural to test the resistance levels that we are crossing and to check whether that resistance level has become a support level, which is what it should become. Continue reading →

Emini Futures Trading Analysis- 21Dec2018

sp500-futures-dailly-chart-analysis-21dec2018

sp500-futures-dailly-chart-analysis-21dec2018-2436

sp500-futures-dailly-chart-analysis-21dec2018-2426

The S&P500 futures are at 2426, now 200+ points below their 20 day SMA (simple moving average) of 2641. I don’t remember the last time there was so much divergence! It is not sustainable and very clearly, the futures are deeply oversold. There is an element of shorting and an element of long unwinding in this recent correction in Dec 2018. The S&P500 has lost 375+ points from the start of December – its a record. I think its the worst December for S&P500 since 1929. The market is acting as if we have a recession next year, but its not the case. However, this kind of selling may force the US Fed to think twice about their futures interest rate hikes in 2019.

Our S&P500 futures trading strategy is to keep buying at levels below 2500 for target of 2600 in Jan 2019, because 2500 is a strong support, and the futures will rapidly move up to 2500 from any level below 2500. The minimum pullback target is 2600, within 2 weeks. 2650 is also possible once during Jan 2019.

[Bonus Trade] Buy at 2420 for target 2500 with Stop loss 2380.
Current price is 2415.


Emini Futures Trading Analysis- 30Oct2018

spx500-futures-30min-chart-analysis-30oct2018

Hello Folks, the S&P500 Emini futures are at 2688 currently. We are are in prime buying zone now, and we need one more confirmation in order to start a 30-50 point trade on the long side.

The futures had failed to hold above the 200 SMA line couple of days back and that caused major damage by the sharp 100 point intraday correction from 2707 to 2603. And now the futures are back above the 200 SMA line, and that indicates strength. This strength will get confirmation when the futures cross 2691, which is the resistance trend line currently.

The trend has reversed to upside, and our Emini Futures Trading Strategy is to stay long above 2670.

[Bonus Trade] Buy at 2695 for Target 2730 with Stop loss 2680.

Emini Futures Trading Analysis- 10Oct2018

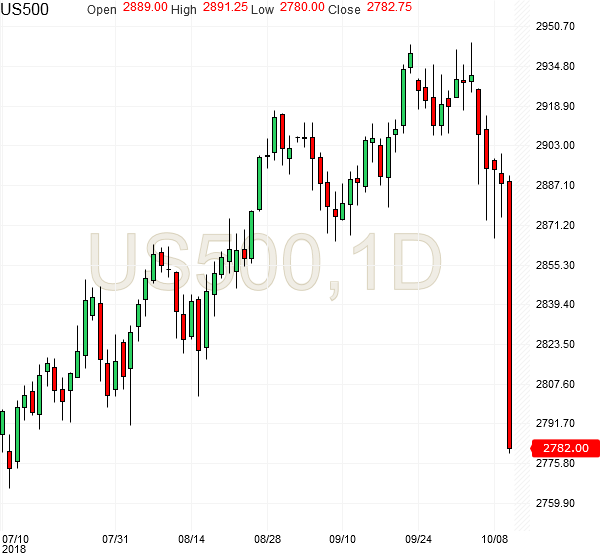
Here’s the closing chart of today, with S&P500 futures down more than 100 points down! We were fortunate to have avoided this large fall today. We will be looking for a suitable buying opportunity once market stabilizes.

spx500-futures-daily-chart-analysis-10oct2018-100pts-down

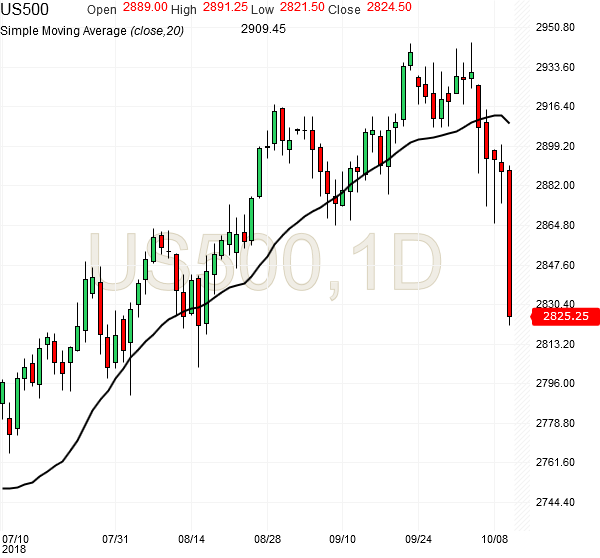
Traders should be careful with #SP500 below 2880 (as mentioned in previous posts). The large correction of today started below 2880. The uptrend is still intact, above 2800, but the setup is not safe/ready for a new long trade.

spx500-futures-daily-chart-analysis-10oct2018

We had a long trade, which hit stop loss at 2920, and we have been out of the market since then because short term weakness was visible, while long term uptrend is still intact.

2828 is the 100 day moving average, and it should provide support for a short term bounce back to 2850-2860. Any reliable long trade will come above 2880. The S&P500 is down 63 points and most of the long positions have broken down today with stop losses.