Emini Futures Trading Analysis- 09Oct2018

spx500-futures-daily-chart-analysis-09oct2018

The S&P500 Emini futures are at 2889.00
Today’s Range: 2874.50 – 2900.00

The futures are testing 2880 level again today, and it also now coincides with the 50 day moving average. Please see the chart. The futures have made a higher high and higher low today, compared to yesterday, which is positive. The futures must close above the 50 day moving average, otherwise downside risk increases rapidly over next 2-3 days.

There is no trade as of now, but today is important and futures must close around 2890 for a chance for upmove by eod Friday. Closing below 2885 will be bearish in the near term, and this is October month – so we need to be extra cautious.
The futures have some work to do here at 2888, and they have to move up above 2900. A suitable long trade in the current market may come at/above 2900, with target 2930, and 2880 as stop loss. Thanks.

Emini Futures Daily Analysis- 28Jun2018

spx500-futures-daily-chart-analysis-28jun2018

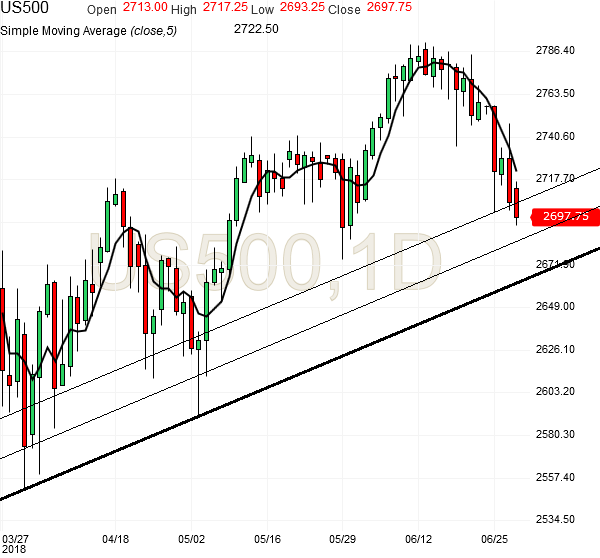
Please see the above chart for S&P500 Futures Technical Analysis. We have plotted 3 support lines. The S&P500 has about 30 points downside more till 2670, where there is strong support, and from there, the S&P500 Emini Futures (ES) should bounce back nicely till 2740. Our Emini Futures Trading Strategy is to buy on corrections because the uptrend is intact above 2500.

[Bonus Trade] Buy at 2675 for Target 2635 with Stop loss 2660.
This bonus trade can give 60 points gain with 15 points stop loss.

Emini Futures Trading Update- 29May2018

Hello Folks, the S&P500 Emini futures are at 2700.50
Today’s Range: 2690.25 – 2724.25

Today early morning, the futures have hit stop loss 2704 in Trade#8.
There is no new general trade as of now, and I will mail you shortly after market analysis.

The futures fell by nearly 30 points in early morning trade, before US markets opened, and went down till 2790. They were unable to cross 2740 last week, and kept coming back to 2720 level, after defending 2704 level, which was our stop loss.

As the futures have bounced back to 2700 again may mean that the fall of today morning was not meant to breakdown the 2700 support level. Our Emini S&P500 Futures Trading Strategy is to stay long above 2700 for targets of 2780-2800. That has not changed. S&P500 Futures Technical Analysis indicates strong support at 2680, and major weakness below 2680 for lower targets of 2600-2630. However, since the futures have tested 2600-2630 level multiple times in last 2 months, that scenario has less probability as of now.

Traders with 5-10+ contracts:
Here are two new optional optional trades with 1-2 contracts each.
(k) “Buy at 2700 for Target 2720 with Stop loss 2690.
(l) “Buy at 2700 for Target 2730 with Stop loss 2680.

[Bonus Trade] For all our website visitors and traders.
“Buy at 2710 for Target 2730 with Stop loss 2700.”
This trade will activate at 2710, which is about 10 points above the current price of 2700. Thanks.

Emini Futures Trading Update- 24Apr2018

spx500-futures-daily-chart-analysis2-24apr2018

Hello Folks, the S&P500 Emini futures are at 2635.75
Today’s Range: 2616.25 – 2688.50

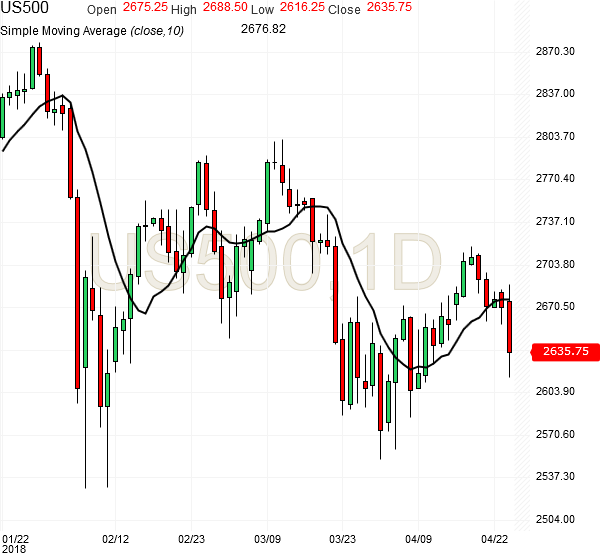
The futures tried to cross 2680 (the known resistance level) but failed, and a series of supports broke, mainly 2650 and 2630, with cascading stop losses. The market is talking about the weakness in FAANG stocks, but it could have been something else too. The set up was getting weak below 2680.

Please refer my mail from last Friday: “The futures may test both 2650 and 2690 in the coming week. The support at 2600 should hold.” Today 2650 was broken but 2600 has held. The probability of 2600 level breaking is low, and even if it breaks, the futures may bounce back within an hour. So we can continue to work with 2600 level as the absolute stop loss.

Traders with 5-10 contracts:
Here is a new optional trade that can be done with 1-2 contracts.
“Buy at 2630 for Target 2666 with Stop loss 2600”

The futures have now lost 80 points from the 2712 level, where we first saw weakness creep in on a bullish set up. We will do a new trade once market stabilizes. Thanks.

Emini Futures Trading Analysis- 13Apr2018

spx500-futures-daily-chart-analysis-13apr2018

The S&P500 Emini Futures have been building a base at 2600 level and they defended it well this week, closing above 2650 this Friday, indicating strength and willingness to go higher. There is clear resistance at 2680, and the clear long trades will start above 2680.

Technical Analysis of S&P500 Futures Daily Chart.

Momentum (14.25) is above zero, indicating an overbought market. The long term trend, based on a 45 bar moving average, is DOWN. The short term trend, based on a 9 bar moving average, is UP. Momentum is indicating an overbought market, and appears to be slowing. Further, a bearish key reversal off a 9 bar new high here supports this outlook.A modest downturn is possible here.

Open Interest is in a downtrend based on a 9 bar moving average. While this is normal following delivery of nearer term contracts, be cautious. Decreasing open interest indicates lower liquidity.

RSI (48.70) is in neutral territory. This indicator issues buy signals when the RSI line dips below the bottom line into the oversold zone; a sell signal is generated when the RSI rises above the top line into the overbought zone. RSI is somewhat oversold at 48.70. However, this by itself isn’t a strong enough signal. We need to look for additional evidence here before getting too bullish here.

CCI (15.41) is in neutral territory. A signal is generated only when the CCI crosses above or below the neutral center region. CCI often misses the early part of a new move because of the large amount of time spent out of the market in the neutral region. Initiating signals when CCI crosses zero, rather than waiting for CCI to cross out of the neutral region can often help overcome this. Given this interpretation, CCI (15.41) is currently long. The current long position position will be reversed when the CCI crosses below zero. The market just signaled a bearish key reversal off a 9 bar new high, suggesting closing any long positions here.

Summary: The technical indicators are giving mixed signals at current level. So are bullish and some are bearish. This is logical and along expected lines because the S&P500 index is just above 200 day SMA at 2600 level, and the index has been testing the 2600 level every week. Below 2600 level, many indicators will turn bearish. So far the S&P500 index has been closing above 2600 on weekly basis, which indicates strength.  The S&P500 is building a base at 2600 level, which can enable the next upmove to 2800-2900 level.

[Bonus Trade]: Buy Emini Futures at 2630 for Target 2660 with Stop loss 2610.
Similar trade was done this week, and it can be done again in the coming week.
Our S&P500 Emini Futures Trading strategy is to remain long above 2600. Thanks.