Emini Futures Trading Analysis- 26May2017

spx500-weekly-chart-26may2017

Emini Futures Trading Strategy:  The S&P500 Emini Futures have bounced back from 2350, and crossed 2400 decisively last week. Now the target is 2450. There will be some resistance around 2420-2430 level, and above that 2450 can come within 1-2 trading sessions. The S&P500 Emini Futures Trading Strategy is to stay long, and buy any correction towards 2400, because 2400 will act as a good support now. The real strong support is at 2380 level. However, fresh long positions should be created only above 2400 level with max stop loss around 2380 level.

[Bonus Trade] Buy S&P500 Emini Futures at 2410 for Target 2450 with Stop Loss 2390. Continue reading →

Emini Futures Trading Analysis- 19May2017

spx500-futures-weekly-chart-19may2017

Market Trend: The futures tested the support level of 2340-2350 this past week, and bounced back from there. If the futures move up above 2383, then higher levels can come in the next 10 days. The futures will become bearish below 2380. So it is a very thin line between bullishness and bearishness in the coming week. A retest of 2360 level is likely, and another retest of 2350 level is also possible, though it is less likely as of now.  The upside targets are visible in the range of 2420-2430. For the immediate term, the key level to defend is 2380. Strong supports are visible at 2250 on the weekly charts, so if you see 2250 for any reason, you can create fresh long positions at 2250 for for a retest of 2280-2290, before any major downside opens.

[Bonus Trade] Traders can go long at 2380 for Target 2420 with Stop loss 2350.

Technical Analysis of S&P500 Emini Futures Weekly Chart

Moving Average Indicator: Price is above the moving average so the trend is up. The market is bullish. However, recently the market has been extremely bullish, however currently the market has lost a some of its bullishness Its possible that we may see a market pullback here. In such a case, the pullback will be a good buying opportunity.

Commodity Channel Index (CCI) Indicator: CCI (70.48) is in neutral territory. A signal is generated only when the CCI crosses above or below the neutral center region. CCI often misses the early part of a new move because of the large amount of time spent out of the market in the neutral region. Initiating signals when CCI crosses zero, rather than waiting for CCI to cross out of the neutral region can often help overcome this. Given this interpretation, CCI (70.48) is currently long. The current long position position will be reversed when the CCI crosses below zero. The market just signaled a bearish key reversal off a 9 bar new high, suggesting closing any long positions here. Continue reading →

Emini Futures Trading Analysis- 05May2017

spx-weekly-chart-05may2017

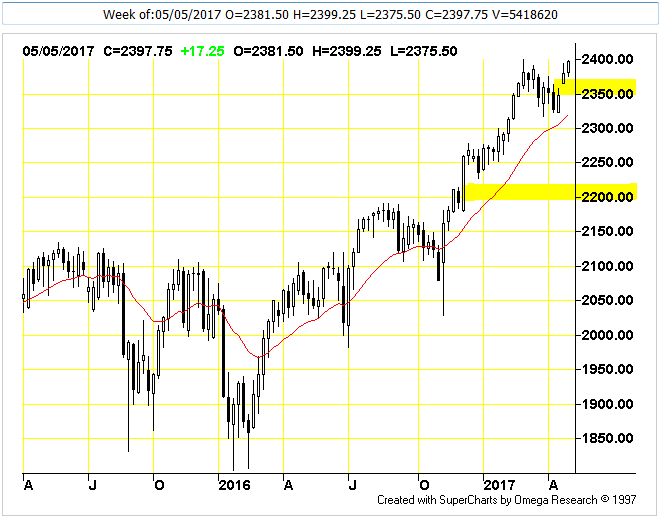
Notes: The above weekly chart is indicating an upmove above 2400 in the coming days/weeks. Major supports on this weekly chart are visible at 2350 and 2200 levels. There is a decent probability of a retest of 2200 sometime in the next 6-12 months, because 2200 was not tested properly on the way up, and the S&P500 usually tests each key level multiple times before making long term upmove above that level.

[Bonus Trade] Buy S&P500 Emini Futures at 2380 for target 2400, with Stop loss 2370. This trade offers 20 points gain with 10 points risk, which is a good deal in a market with positive bias. Continue reading →

Emini Futures Trading Analysis- 28Apr2017

spx-weekly-chart-28apr2017

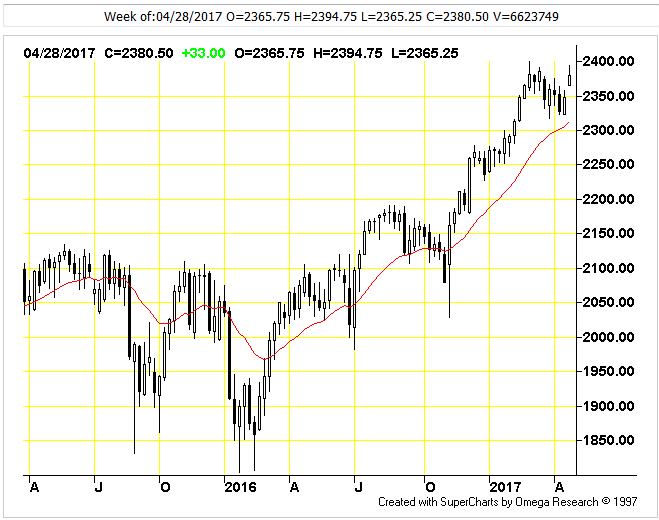
Trend: The S&P500 index futures are currently bullish, but with a clear resistance at 2400 level, which is just 20 points above the current 2080 level. The weekly chart is pointing to higher prices in the coming months, though we may see some correction in the near term due to the sharp run up in the last few days. The futures appear overbought, but may continue to become more overbought before reversing. Traders should look for some price weakness before taking any bearish positions.

Levels: There is a good buying support at 2330 level. The futures will remain bullish as long as they are trading above 2300 level. Upside targets of 2400 were visible to us even when futures were at 2330 level. The futures are currently in uptrend, but now we are close to the ceiling/upper limit. There is a strong resistance at 2400 level. This 2400 level was our target when futures were down at 2330, and there will be selling pressure near 2400 level. The futures need to close above 2410 for the next leg of upmove. The futures will face increased selling pressure below 2380 and 2360 level can be tested again. From 2380 level, there is a 50-50 chance of going down to 2350 or going above 2400. Therefore, we can only do optional/tactical trades till we get clarity on the direction. The big target of 2500 is intact for this year, so we will go long at suitable times.

Bonus Trades:
(a) Traders can take long positions above 2410 for Target 2440 with 2390 as Stop loss. This trade would offer 30 points gain with 20 points risk.
(b) Traders can take short positions below 2300 for Target 2250 with 2320 as Stop loss. This trade would offer 50 points gain with 20 points risk. Continue reading →

Emini Futures Trading Analysis- 26Mar2017

Hello Folks, the S&P500 Emini futures are at 2342.25
It has taken longer to complete my analysis, because the futures have closed at a critical stage, from where the direction can change from long bias to short bias. Such critical levels involve days with 20 point swings on daily basis, which we saw this week.

Summary of my Emini futures analysis is this:
We should be long above 2330, and we should be short below 2330.

This is a slightly long mail but please read it carefully.
The long trade, which started in Nov 2016 (Trump rally) maybe coming to an end now in March 2016, unless futures bounce back above 2360 with a emphatic 20-30 point upmove to close above 2360. Continue reading →