Emini Futures Trading Update – 26Aug2016

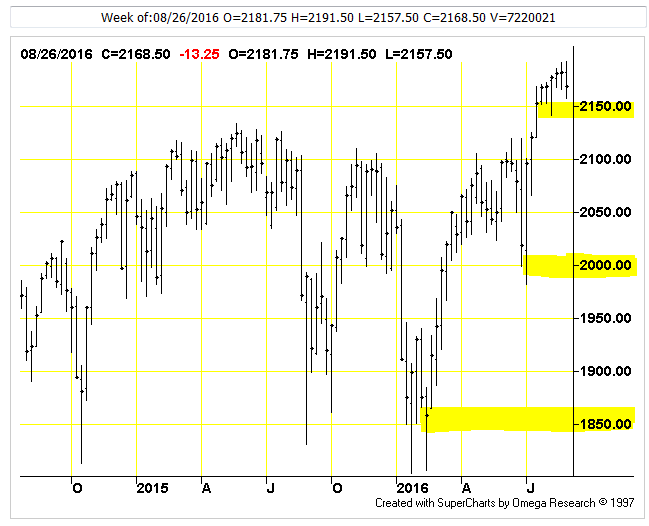
sp500-emini-futures-weekly-chart-26aug2016

Here is the weekly chart of S&P500 Emini futures. The current upside target is 2200. The 3 major support levels are marked in yellow. They are at: 2150, 2000, 1850. As you will observe, they are at a gap of 150 points each. We can hold long positions with 2150 as stop. Between 2150 and 2100, its a zone of indecision and we can avoid long or short trades. Below 2100, we can sell Emini futures for targets of 2020 with stop of 2120. If the index goes into a correction mode, we have to wait aside for the fall to stop and a green week to come, which will indicate larger buyers are stepping in. Only then, we can consider new long positions in Emini futures. Thanks.


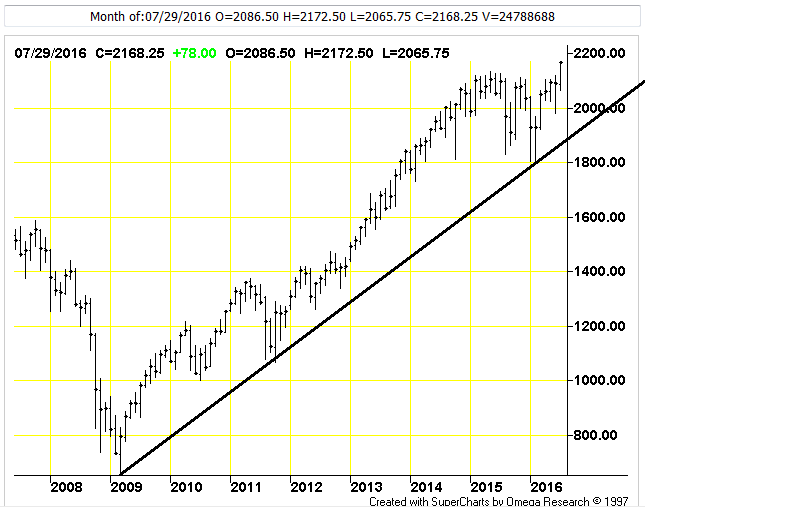
S&P500 Futures Monthly Chart Analysis – 29July2016

Following is the S&P500 Futures Monthly Chart over last 10 years from August 2017 to July 2016. The S&P500 index futures have been moving up firmly on the support of a long term trend line since March 2009. Like all trend lines, this trend line will also break one day, and open the way for larger downside. We don’t know when that will happen, so we have to trade with cautious, every time we bounce away from the trend line because there is a strong tendency to revert back to it, which is currently at 1900, or 265 point behind. sp500-futures-monthly-chart-29july2016

On the upside, 2200 is a reliable target, and it can come in August if some major bad news does not come. As mentioned previously on this website, our strategy for year 2016 has to been to stay long above 2000, and that has worked well, and we have 165 points gain on the positional trade, which has been done in several parts over last 4 months. August is a month of high volatility and we have to be cautious.

Emini Futures Trading Update- 06July2016

Following is our email sent to subscribers on July 6, 2016.

Hello Folks, the futures are currently at 2086. They have recovered nicely from day low of 2066. However, selling pressure is visible on daily charts, and today’s lower level buying may not hold if fresh round of selling comes. At the same time, the V-shape recovery from lower levels after Brexit is impressive. It is possible that 2100 on futures will get tested again.

——————————————–
Please note our Emini Futures Trading Strategy for this July month: The 2053 number in futures is still intact as the dividing line for positional long and short trades. Below 2053, we start a short trade with 2063 as stop. Above 2053, we start a long trade with 2043 as stop.
——————————————–

* Traders with 1-2 contracts: There is no trade as of now for you.
* Traders with 5-10 contracts: You may buy 1-2 contracts at 2086 for target 2096, with Stop 2076. This tactical trade can play out by Friday. Thanks.

Emini Futures Trading Update – 13Apr2016

Wednesday, April 13, 2016, 9.45am, New York – Hello Folks, the futures are currently at 2069. For Trade#2 of April, our target of 2067 has been hit successfully today morning. I was expecting it to come by Friday as mentioned in the email last evening. But the momentum is strong and our target got hit today morning itself. This completes Trade#2, with 28 points gain from.

Trade#2 of April 2016 (completed)
------------------------------------
Buy at: 2039
Target: 2067 (hit on April 13, 2016)
Stop: 2030
------------------------------------

This trade has moved fast, and its good we took this immediately after our Stop Loss on Trade#1. We will wait for the index to take a breather after the hectic 40 point upmove from 2030 to 2070 in the last 2 days since Monday morning, and then decide our next trade.

[Emini Futures Trading Strategy] The S&P500 has strong resistance at 2075-2080 level, which translates to about 2070-2073 levels on the SPX/ES futures. However, the S&P500 index is in positive buy zone above 2058, which translates to about 2050 level of the futures. If the S&P500 index goes below 2000 for any reason, all longs must be closed. Of course we will be having predefined Stops much above 2000 level.

[Bonus Trade] Large Traders with 5-10 contracts: You may Sell 2-3 contracts at 2068, for Target 2058, and Stop 2075. This is a tactical trade that aims to benefit from the inevitable profit booking that may come today or tomorrow. Thanks & Best Wishes.

Emini Futures Trading Update – 18Mar2016

sp500-emini-futures-weekly-chart-18mar2016

S&P500 Technical Analysis – for Week of 18 March 2016

The above weekly chart of S&P500 Emini Futures indicates a triple bottom at 1850, and hence a strong bounce back, which has the strength to go all the way till 2100. We have got 5 green weeks back to back, which is one of the most powerful rallies in recent years. Above 2100, the market opinion will be very divided, and there will be enough people willing to short, and any further advances above 2100 will need good support from strong corporate earnings and global macroeconomics data.

Moving Average Indicator: The market is very BULLISH. Everything in this indicator is pointing to higher prices: the fast average is above the slow average; the fast average is on an upward slope from the previous bar; the slow average is on an upward slope from the previous bar; and price is above the fast average and the slow average. Market trend is UP as long as the S&P500 index is above 2000 level.

Momentum Indicator: Momentum (138) is way above zero, indicating an overbought market. The long term trend, based on a 45 bar moving average, is DOWN. The short term trend, based on a 9 bar moving average, is UP. Momentum is indicating an overbought market. However the market may continue to become more overbought. Look for further evidence of weakness before getting bearish here. Momentum is likely to increase above 2050 on S&P500 index. So avoid short positions above 2050. Continue reading →