Emini Futures Trading Update – 13Apr2016

Wednesday, April 13, 2016, 9.45am, New York – Hello Folks, the futures are currently at 2069. For Trade#2 of April, our target of 2067 has been hit successfully today morning. I was expecting it to come by Friday as mentioned in the email last evening. But the momentum is strong and our target got hit today morning itself. This completes Trade#2, with 28 points gain from.

Trade#2 of April 2016 (completed)
------------------------------------
Buy at: 2039
Target: 2067 (hit on April 13, 2016)
Stop: 2030
------------------------------------

This trade has moved fast, and its good we took this immediately after our Stop Loss on Trade#1. We will wait for the index to take a breather after the hectic 40 point upmove from 2030 to 2070 in the last 2 days since Monday morning, and then decide our next trade.

[Emini Futures Trading Strategy] The S&P500 has strong resistance at 2075-2080 level, which translates to about 2070-2073 levels on the SPX/ES futures. However, the S&P500 index is in positive buy zone above 2058, which translates to about 2050 level of the futures. If the S&P500 index goes below 2000 for any reason, all longs must be closed. Of course we will be having predefined Stops much above 2000 level.

[Bonus Trade] Large Traders with 5-10 contracts: You may Sell 2-3 contracts at 2068, for Target 2058, and Stop 2075. This is a tactical trade that aims to benefit from the inevitable profit booking that may come today or tomorrow. Thanks & Best Wishes.
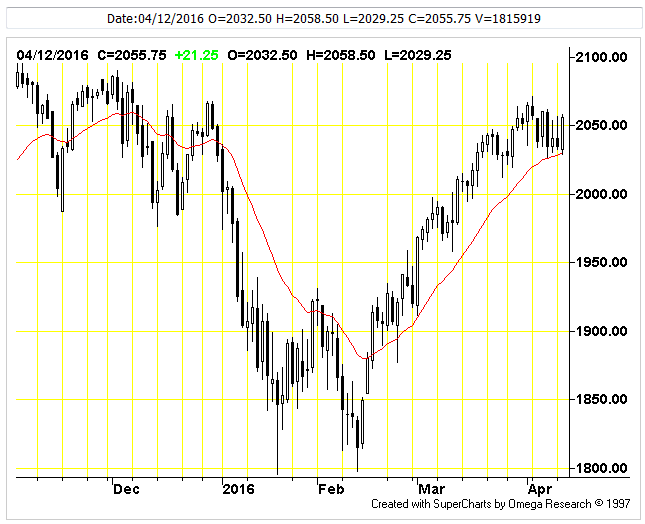
Emini Futures Trading Update – 12Apr2016

spx-daily-chart-12apr2016

Technical Analysis of S&P500 Index Futures

RSI Indicator: RSI is in neutral territory. (RSI is at 60.57). This indicator issues buy signals when the RSI line dips below the bottom line into the oversold zone; a sell signal is generated when the RSI rises above the top line into the overbought zone. RSI is somewhat overbought (RSI is at 60.57). However, this by itself isn’t a strong enough indication to signal a trade. Look for additional evidence before getting bearish.

CCI Indicator: CCI (57.58) is in neutral territory. A signal is generated only when the CCI crosses above or below the neutral center region. CCI often misses the early part of a new move because of the large amount of time spent out of the market in the neutral region. Initiating signals when CCI crosses zero, rather than waiting for CCI to cross out of the neutral region can often help overcome this. Given this interpretation, CCI (57.58) is currently long. The current long position position will be reversed when the CCI crosses below zero. Continue reading →

S&P500 Emini Futures Trading Update- 19Jan2016

Date: Jan 19, 2016 | 09:45 am US EST, New York.
Hello Folks, good morning. A long weekend break has helped to calm down the market’s nerves, and Asian markets did well, and European markets (CAC, DAX) are in bright green with 2% gains, so the global market sentiment is recovering from extreme bearish mood. However, we can’t say whether sentiment will recover fully or get bearish again after 2-3 days. We will let the S&P500 index decide that for us. For now, the S&P500 is underperforming the other markets with weaker gains off the start. We can expect something better from current levels.

The futures are currently at 1888. The next buy signal will come above 1895, and we can aim for 10-20 points from there. Traders can aim to buy the futures above 1896 with 8-10 point stop, and target gain of 20-25 points. A clear and stronger buy signal will come at 1919 in futures. So one can go long on S&P500 Emini Futures above 1920 for targets of 1943-1947.

Afternoon Update: 1:30 pm US EST, New York.
The futures are currently at 1875. They have given up the gains from the gap up opening in the morning.
After my previous message in the morning, the futures went up till 1894.50 and fell back, while our first buying trigger would have come at 1895, and buying order was set at 1896. So it came very close to triggering our buy order, which would have resulted in hitting a stop loss. So we have saved money today with our analysis and suitable placement of orders.

The selling momentum has reduced and CBOE Put/Call Ratio is indicating that we maybe near a reversal move, which can take the S&P500 to about 1970-1980 levels before next major resistance comes. We will wait for the suitable buying triggers to come, taking one step at a time.

S&P500 Becomes a Buy today at 2076

The S&P500 index has given a fresh Buy Signal today with a closing at 2076 (spot). The immediate reliable target is 2100 (spot), with a stop loss of 2067 (spot) on closing basis. This target should come within July. So this presents an opportunity to make 20-25 points on the Emini Futures this month. We are sharing this trade as a bonus for our regular website visitors.

Traders Please Note: It pays to trade the S&P500 Emini Futures with S&P500 spot price levels because the long term charts are available for S&P500 index, even though the S&P500 Emini Futures maybe trading at a discount or premium. Its true that Emini Futures tend to have a larger daily high-low band because of gap ups and gap downs, and pre-market trading which tend to extrapolate trends from other markets.

Trading with S&P500 Emini Index (spot prices) will help us keep our sanity over long term, even if we miss a few points here and there. Always watch the S&P500 index level to see daily, weekly closing.