Emini Futures Trading Analysis- 05Jan2018

spx500-futures-weekly-chart-analysis-05jan2018

Summary: The S&P500 futures are bullish on multiple indicators, and they can move up further before selling pressure can prevail. The S&P500 futures closed this week at 2742.50, and 2780 is the next upside target. It may come within next 1-2 weeks because the futures are moving up with high momentum, and the gradient of the current move is nearly vertical. It also seems to indicate that we are in some late stage of this bull market rally, where greed is all around, and fear is nowhere in sight. The major support levels are at: 2680, 2580, 2500.

[Bonus Trade] Buy S&P500 Emini Futures at 2742 for Target 2770 with Stop loss 2730.

S&500 Futures Weekly Chart – Technical Analysis
Date: Jan 05, 2018

Moving Average Indicator: Price is above the 20 day moving average so the market trend is up. Only long positions are needed. No question of short positions.

Bollinger Bands Indicator: The Bollinger Bands are indicating an overbought market, which occurs when the close is nearer to the top band than the bottom band. Volatility appears to be picking up a bit, as evidenced by an increasing distance between the upper and lower bands over the last few bars. The market appears overbought, but may continue to become more overbought before reversing. Given that we closed at a 45 bar new high, the chance for further bullish momentum is greatly increased. Look for clear evidence of price weakness before taking any bearish positions based on this indicator.

Volatility Indicator: Volatility is trending up based on a 9 bar moving average.

Momentum Indicator: Momentum (164) is above zero, indicating an overbought market. The long term trend, based on a 45 bar moving average, is UP. The short term trend, based on a 9 bar moving average, is UP. Momentum is in bullish territory.upside move is likely. And, the market put in a 45 bar new high here. More highs/ new highs are possible.

Commodity Channel Index (CCI) Indicator: The CCI (155) recently crossed above the buy line into bullish territory, and is currently long. This long position should be liquidated when the CCI crosses back into the neutral center region. CCI often misses the early part of a new move because of the large amount of time spent out of the market in the neutral region. Initiating signals when CCI crosses zero, rather than waiting for CCI to cross out of the neutral region can often help overcome this. Given this interpretation, CCI (155) is currently long. The current long position position will be reversed when the CCI crosses below zero. The market just reached a 45 bar new high, adding bullish pressure.

RSI Indicator: RSI has issued a bearish signal (RSI is at 86.21). When RSI crosses above the overbought line (currently  set at 80.00) a sell signal is issued. While RSI is in overbought territory (RSI is at 86.21), the market may continue to become more overbought before a top is established, particularly given the 45 bar new high here. Look for a downturn in RSI before taking any bearish positions based on this indicator.

MACD Indicator: MACD is in bullish territory, but has not issued a signal here. MACD generates a signal when the FastMA crosses above or below the SlowMA. The long term trend, based on a 45 bar moving average, is UP. The short term trend, based on a 9 bar moving average, is UP. MACD is in bullish territory. And, the market just put in a 45 bar new high here. Look for more new highs.

Open Interest Indicator: Open Interest is in a downtrend based on a 9 bar moving average. While this is normal following delivery of nearer term contracts, be cautious. Decreasing open interest indicates lower liquidity, and lower willingness to participate at current levels. So don’t expect buyers to come in readily on small corrections.

Volume Indicator: The current new high is not accompanied by increasing volume, suggesting that the current  move lacks broad participation. Look for a retracement soon. The long term market trend, based on a 45 bar moving average, is UP. The short term market trend, based on a 5 bar moving average, is UP.The current new high is not accompanied by increasing volume, suggesting that the current move lacks broad participation and the market may be overbought. A retracement is possible here.

Slow Stochastic Indicator: The SlowK line crossed above the SlowD line; this indicates a buy signal. The stochastic is in overbought territory (SlowK is at 96.05); this indicates a possible market drop is coming. The long term trend is UP. The short term trend is UP. Even though the stochastic is signaling that the market is overbought, don’t be fooled looking for a top here because of this indicator. The stochastic indicator is only good at picking tops in a Bear Market (in which we are not). Exit long positions only if some other indicator is giving a strong sell signal.

Disclaimer: The above analysis is meant solely for the understanding of technical analysis of the S&P500 index futures. It is not meant to provide any investment advice.
Emini Futures Trading Analysis- 29Dec2017

spx500-futures-weekly-chart-analysis-29dec2017

S&500 Futures Weekly Chart Analysis:

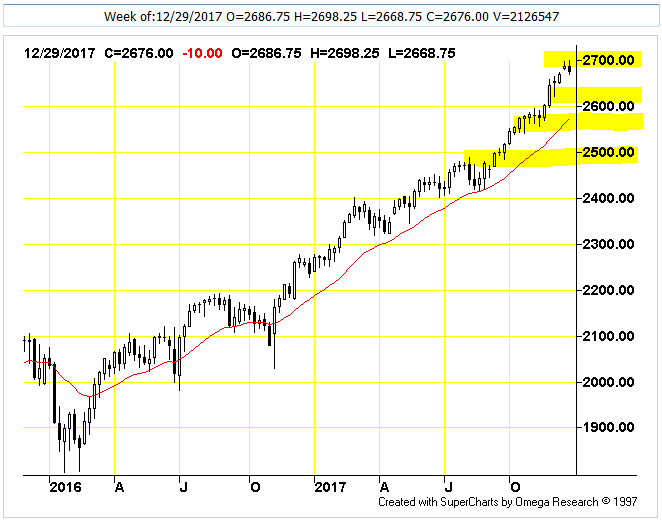
  • Clear resistance / selling pressure at 2700 level got reconfirmed this week as the futures failed to cross 2700 and fell back sharply on the last trading day of the year.
  • The next support is at 2630-2650 level, so the futures are likely to test these levels in Jan 2018.
  • The next lower support is at 2580 level, and this should be a strong support because it was tested multiple times spanning several weeks. Any regular correction should find support at 2580 level.
  • 2500 remains a high probability target on the lower side for H1 2018. If it is tested successfully, then upside targets of 2800+ will open up / come in the picture.
  • Traders must be ready for volatility as 2018 is likely to show some volatility consolidation pattern after the clean upmove of 2017, which never broke the uptrend even once.
  • Our broad S&P500 Futures Trading Strategy will be to buy on corrections of 40-50 points, for bounce back after a few days. And we will buy afresh on breakouts after consolidation, because such breakouts have typically given 30-50 points.

Technical Analysis of Weekly Charts

Moving Average Indicator: Price is above the moving average so the market trend is up. The market is Bullish. Everything in this indicator is pointing to higher prices in the coming weeks.

Bollinger Bands Indicator: The Bollinger Bands are indicating an overbought market. An overbought reading occurs when the close is nearer to the top band than the bottom band. Volatility appears to be picking up a bit, as evidenced by an increasing distance between the upper and lower bands over the last few bars. The market appears overbought, but may continue to become more overbought before reversing. Look for some price weakness before taking any bearish positions based on this indicator.

Volatility Indicator: Volatility is trending up based on a 9 bar moving average.

Momentum Indicator: Momentum (102) is above zero, indicating an overbought market. The long term trend, based on a 45 bar moving average, is UP. The short term trend, based on a 9 bar moving average, is UP. Momentum is indicating an overbought market, and appears to be slowing. Further, a bearish key reversal off a 9 bar new high here supports this outlook. A modest downturn is possible here.

Commodity Channel Index (CCI) Indicator: CCI (130) recently crossed above the buy line into bullish territory, and is currently long. This long position should be liquidated when the CCI crosses back into the neutral center region. CCI often misses the early part of a new move because of the large amount of time spent out of the market in the neutral region. Initiating signals when CCI crosses zero, rather than waiting for CCI to cross out of the neutral region can often help overcome this. Given this interpretation, CCI (130) is bullish, but has begun showing some weakness. Begin looking for an attractive point to liquidate long positions and return to the sidelines.

RSI Indicator: RSI (81) has issued a bearish signal. When RSI crosses above the overbought line (currently set at 80.00) a sell signal is issued. RSI is in overbought territory and has reversed, offering a reasonably strong bearish signal. Supporting this outlook, the bearish key reversal off a 9 bar new high here also indicates the potential for a decline.

MACD Indicator: MACD is in bullish territory, but has not issued a signal here. MACD generates a signal when the FastMA crosses above or below the SlowMA. The long term trend, based on a 45 bar moving average, is UP. The short term trend, based on a 9 bar moving average, is UP. MACD is in bullish territory. However, the recent downturn in the MacdMA may indicate a short term decline within the next few bars. A bearish key reversal off a 9 bar new high here confirms this bearish outlook.

Open Interest Indicator: Open Interest is in a downtrend based on a 9 bar moving average. While this is normal following delivery of nearer term contracts, be cautious. Decreasing open interest indicates lower liquidity.

Volume Indicator: The long term market trend, based on a 45 bar moving average, is UP. The short term market trend, based on a 5 bar moving average, is UP. A bearish key reversal off a 5 bar new high here here suggests a decline, and decreasing volume supports the likelihood of a downturn in the market.

Slow Stochastic Indicator: The SlowK line crossed below the SlowD line; this indicates a sell signal. The stochastic is in overbought territory (SlowK is at 92.43); this indicates a possible market drop is coming. The long term trend is UP. The short term trend is UP. Even though the stochastic is signaling that the market is overbought, don’t be fooled looking for a top here because of this indicator. The stochastic indicator is only good at picking tops in a Bear Market (in which we are not). Exit long position only if some other indicator tells you to.

Disclaimer: The above analysis is meant solely for the understanding of technical analysis of the S&P500 index futures. It is not meant to provide any investment advice.
Emini Futures Trading Analysis- 27Oct2017

spx500-futures-weekly-chart-27oct2017

S&P500 Market Analysis: The S&P500 index futures have been moving up week after week, for the last 10 weeks, which is one of the longest patch of green weeks with gains, without a red week. Traders should watch out for strong resistance at 2580 level. It will not be easy to cross. 2500 is a large long term target for this market, so reversal to 2500 is imminent or just a matter of time. We may do some more long trades while the trend us up, but we should not forget that 2500 can come any day, any week – it is a very real target for this market, and 2500 needs to be tested several times before a sustainable upmove above 2600 can happen.

S&P500 Support Levels: The two key support levels for the S&P500 futures are: 2500 and 2400, which will be useful to absorb minor sell-offs, and 2100 is a strong support that can defend against major sell offs. The long term support for this market is still at 1600, and that is not changing anytime soon. The zone between 1600 and 2100 should good for buying and holding for big gains. Continue reading →

Emini Futures Trading Analysis- 08Sep2017

spx-500-futures-daily-chart-analysis-08sep2017

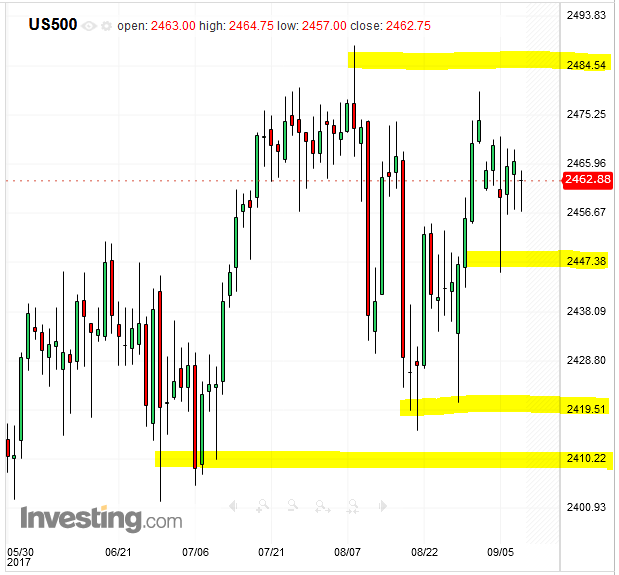
The S&P500 Emini Futures are currently at 2463. The futures have been testing various support levels like 2410-2420 to 2440-2450 over the last 2 months, and they are preparing for a fresh attempt to cross 2480. Previous attempt failed and the futures fell nearly 70 points from 2488 till 2420. So the futures are taking their time in testing all support levels in order to launch a fresh attempt to cross 2480 and go towards 2500.

There is a solid resistance/ selling pressure at 2480-2483 level, and it will need a strong push to cross it. There can be no room for selling pressure around 2483 otherwise 30-40 points will be loss rapidly, and all the effort in creating longs will be wasted again. Such an effort may happen in the next 1-2 weeks.

[Bonus Trade]
Buy S&P500 Emini Futures at 2463 for Target 2483 with Stop loss 2443.

Emini Futures Trading Analysis- 12Aug2017

Hello Folks, the S&P500 Emini futures closed at 2440.50
Last week was outright bearish for the S&P500 index, for whatever reasons. We all know the market has been moving up without major correction, and it was going to come sooner or later. I was up till 2 am last night and back up again early today morning to do my market study. The market is making me uneasy after a long time. We have been long with confidence since Jan-Feb 2016, and whatever stop-loss we had along the way, was due to market whipsaws, but not due to trend change. The upside targets were always intact. However, now that seems to be changing. My upside target of 2500 was almost achieved by the S&P500 index, which made a high of 2490 (just 10 points less than 2500). The futures went till 2488, and reversed, which was a bearish sign. But the next day gave a bullish reversal, which offered support to market, and then we got a 40 point cut from 2470 to 2430 the next day, which has wiped out most of the recent long positions.

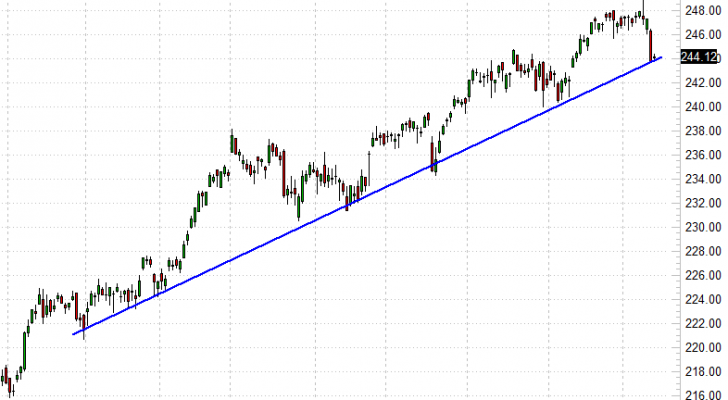
Please see this daily chart of S&P500 Index ETF (SPY)
spy-etf-chart-11aug2017

The S&P500 index is literally sitting on support line at 2440. The index has used this support line a few times in recent months to bounce back and resume the uptrend. Every time the index tests the support line, the index will gain some strength, but the support line becomes weaker. One of these times, the support line will give away, and we may get 80-100 point fall within a week. It is this possibility of a sharp fall below 2440 that is making me rethink our trading strategy for August. We wanted to be cautious in August from the start, and the setup is looking weak.

We will have to start a short trade at some point, and I am thinking what that point would be. The market won’t give second chances in a correction, as we saw this week. The short trades tend to be 3-4X faster than long trades, and therefore, its very difficult to catch them midway unless we are already in the trade.

One way to handle such a situation is to buy and hold SPY put options. We have done this in the past, and in case of any large market fall, the Put options work like short futures, at a fraction of the cost of futures.

My recommendation is to hold this put option: SPY Sep 2017 240 Put
https://finance.yahoo.com/quote/SPY170915P00240000

Expiry Date: Sep 15, 2017. Last traded price was $2.60
Contract size is 100. So each Put option contract will cost $260. Traders can hold a few contracts. This will offer good protection/hedge in this market till its expiry, which is one month away, and much of the current volatility would play out by then. If the futures have to go fall by 100 points to 2350, they may do it in the next 4 weeks.

Please note: the above put option is a just a suggestion, and the setup looks suitable to hold some put options. You may consider it a Bonus Trade.

With S&P500 Emini Futures, we will aim to close our long trade between 2450-2460 on Monday/Tuesday, and we will look for a short trade below 2440. The futures have to move above 2475 for the current bearish pattern to end. That’s why I was thinking of staying long with target of 2473, but it looks less likely now, compared to a retest of 2410-2420 level. I will mail you separately for this because my analysis is not complete yet. It is complex when the futures have dropped quickly to a support line, and probability of further correction is high. Please wait for my next mail with specific next steps. Thanks.