Emini Futures Trading Analysis- 13Apr2018

spx500-futures-daily-chart-analysis-13apr2018

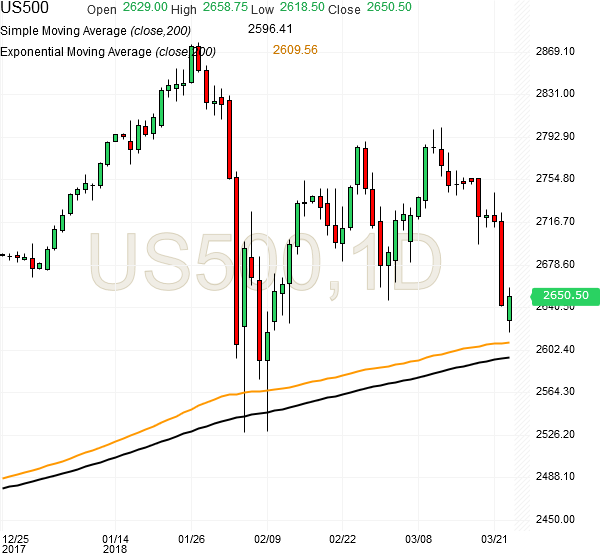
The S&P500 Emini Futures have been building a base at 2600 level and they defended it well this week, closing above 2650 this Friday, indicating strength and willingness to go higher. There is clear resistance at 2680, and the clear long trades will start above 2680.

Technical Analysis of S&P500 Futures Daily Chart.

Momentum (14.25) is above zero, indicating an overbought market. The long term trend, based on a 45 bar moving average, is DOWN. The short term trend, based on a 9 bar moving average, is UP. Momentum is indicating an overbought market, and appears to be slowing. Further, a bearish key reversal off a 9 bar new high here supports this outlook.A modest downturn is possible here.

Open Interest is in a downtrend based on a 9 bar moving average. While this is normal following delivery of nearer term contracts, be cautious. Decreasing open interest indicates lower liquidity.

RSI (48.70) is in neutral territory. This indicator issues buy signals when the RSI line dips below the bottom line into the oversold zone; a sell signal is generated when the RSI rises above the top line into the overbought zone. RSI is somewhat oversold at 48.70. However, this by itself isn’t a strong enough signal. We need to look for additional evidence here before getting too bullish here.

CCI (15.41) is in neutral territory. A signal is generated only when the CCI crosses above or below the neutral center region. CCI often misses the early part of a new move because of the large amount of time spent out of the market in the neutral region. Initiating signals when CCI crosses zero, rather than waiting for CCI to cross out of the neutral region can often help overcome this. Given this interpretation, CCI (15.41) is currently long. The current long position position will be reversed when the CCI crosses below zero. The market just signaled a bearish key reversal off a 9 bar new high, suggesting closing any long positions here.

Summary: The technical indicators are giving mixed signals at current level. So are bullish and some are bearish. This is logical and along expected lines because the S&P500 index is just above 200 day SMA at 2600 level, and the index has been testing the 2600 level every week. Below 2600 level, many indicators will turn bearish. So far the S&P500 index has been closing above 2600 on weekly basis, which indicates strength.  The S&P500 is building a base at 2600 level, which can enable the next upmove to 2800-2900 level.

[Bonus Trade]: Buy Emini Futures at 2630 for Target 2660 with Stop loss 2610.
Similar trade was done this week, and it can be done again in the coming week.
Our S&P500 Emini Futures Trading strategy is to remain long above 2600. Thanks.

Emini Futures Trading Update- 11Apr2018

Hello Folks, the S&P500 Emini futures are at 2653.00
Today’s Range: 2626.00 – 2661.25

The futures have been volatile so far this week, moving up down 30-40 points rapidly, and such moves will break any trading set up. So our decision to wait and watch is proving right as of now.

The futures are back above 2650 currently after an intraday fall to 2626, which is a positive sign. They have been testing 2630-2640 support level everyday this week, and if that testing is completed successfully, we can see an upmove to 2680-2700. Reliable trades will be possible above 2680.

In the last few weeks, the S&P500 has been facing sharp knee jerk selling of 30-40 points suddenly during the day, or after market hours. That is not a regular feature, so we have to wait for some more time for the S&P500 to give a double confirmation on the upmove. The down move is mostly locked out at 2600, which is also the 200 day SMA. Continue reading →

Emini Futures Trading Update- 09Apr2018

Hello Folks, the S&P500 Emini futures are at 2650.50
Today’s Range: 2609.25 – 2651.25

We have let the futures stabilize over the last 1 week, and the daily volatility has reduced a bit from Mach last week, after repeated successive testing of 2600 level, which is the 200 Day SMA and EMA. So the futures are safe currently, but the set up is not yet strong enough for a general trade. The setup will become strong above 2700, where we can do trades with 20 point stop loss with more reliability. Currently 20 point stop loss can be hit despite getting market direction right.

Traders with 5-10 contracts:
Here’s a new optional trade that can be done with 1-2 contracts.
“Buy at 2630 for Target 2680 with Stop loss 2600”
This trade will trigger if there is a 20 point pullback.
As mentioned earlier, 2600 is the absolute stop loss, and we can stay long above it with a few contracts.

So far all buying after every sharp fall at/below 2600 has rewarded with a reversal to 2650. So it looks like the S&P500 is repairing the damage caused in Feb-March. Upside target of 2850-2900 is intact. Thanks.

Emini Futures Trading Update- 28Mar2018

spx500-futures-chart-analysis-28mar2018Hello Folks, the S&P500 Emini futures are at 2610.00
Today’s Range: 2593.00 – 2633.50

The futures are holding above 2600, which is positive for now. Yesterday, they fell below 2600 twice and in between bounced up above 2630 and again fell back to 2600, hitting our absolute stop loss at 2600. The futures went above 2630 briefly, which is the safety zone, but fell back to 2600. The market has been more volatile than I expected because futures have come back to their 200 day SMA after testing it just 2 days back, which is very uncommon, and we got a cascade of stop losses till 2593.

We had a high quality set up at 2650, which hit stop loss at 2630. And unfortunately 2630 was picked up in the bounce from 2600, and that breakout failed. That breakout setup at 2630 came for the first time after 07 March 2018, after nearly 3 weeks, so we trusted it, like many others, but it failed. There is enormous stress in the market currently, and 2600 is the last point of long trade. Continue reading →

Emini Futures Trading Analysis- 23Mar2018

spx500-futures-daily-chart-analysis-23mar2018

Hello Folks, the Emini S&P500 (ES) futures are at 2650. The futures broke their support at 2650 yesterday and went down till 2620 today morning, and have recovered from there back to 2650. However, 2600 is most likely to be tested once before any reversal, because the 200 day SMA is at 2596 currently, and the 200 day EMA is at 2610 currently. So the futures will most likely test 2600 level today or in the next couple of days before we can expect a reliable reversal.

We can expect a reversal from 2600 towards 2700 because the fundamentals of S&P500 companies are in good shape. But its very rare to see a reversal without testing the 200 day SMA when the index is so close to it. Strong support is at 2580, which should hold this time. Resistance is at 2680 and 2780. Please see the attached chart. Continue reading →