Bonus Trade– Emini Futures Trading– 13Oct2016

New York, 3.45 pm EDT
Hello Folks, the S&P500 Emini futures are at 2127.50
The previous trade hit stop loss, and futures have bounced back.
Here is our next trade.

Trade#4 of Oct 2016
—————————————
Buy Emini Futures at 2128 for target 2156 with Stop 2115
—————————————
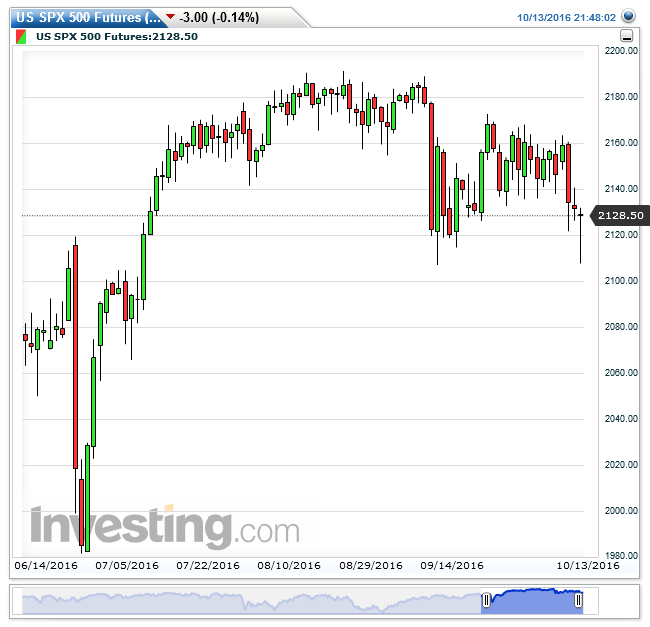
Trade Rationale: We are taking 13 points risk, for 28 points reward. And the set up is as good as it can get. Today, the bottom formation looks emphatic.
sp500-emini-futures-daily-chart-13oct2016

Please Note: Once the S&P500 Emini futures move above 2140, then the Stop Loss can be increased to 2128 (buying price), and target can remain 2156. Above 2153, the targets of 2175-2180 will restart. So the same trade can be continued, or a new trade can be taken.

Bonus Trade– Emini Futures Trading– 12Oct2016

New York City, 10.00 am US EST.
Hello Folks, the S&P500 Emini futures are currently at 2133.
Here is a bonus trade for website visitors.
——————————————————————————
Buy Emini Futures at 2133 for target 2152 with Stop 2123
——————————————————————————
Risk = 10 points // Reward = 19 points. This trade my take 2-3 days.
Probability of success is very high (90%).

Here is the S&P500 futures 5-Hourly chart. Today’s set up is a bullish pullback, as good as it can get. There was a pull back attempt yesterday and the lows kind of got tested today and yet another pullback is happening currently. This is a good setup that we must buy. It has given us good profits in the past.
sp500-emini-futures-chart-12oct2016

Emini Futures Trading Update – 31Aug2016

sp500-emini-futures-daily-chart-31aug2016

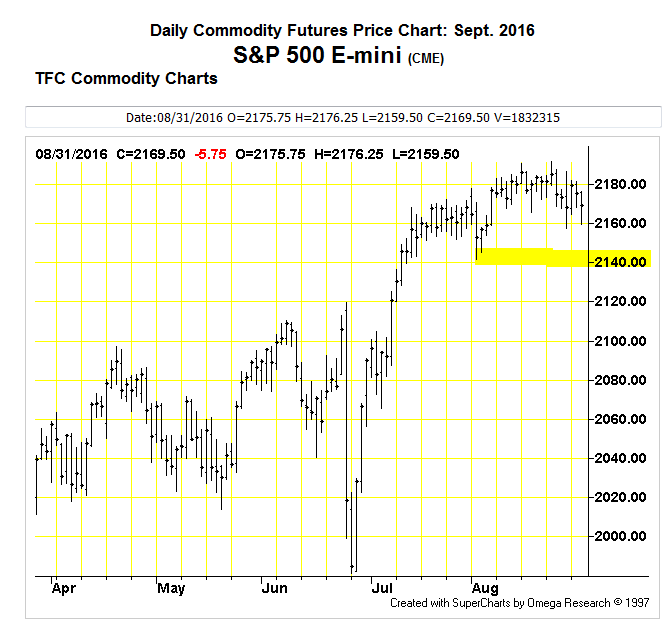
The S&P500 Emini futures closed at 2169.50 while the S&P 500 index closed at 2170.95. The futures discount has narrowed a lot in recent days to just about 2 points from about 9 points a month back. As indicated in the above chart, 2140 is strong support because 2134 was the previous high and now it is the base.

Our analysis is that S&P 500 index will test 2200 once and any major fall can happen after that or on the very same day that 2200 is tested.So the trading strategy is to remain long, and buy the dips and sell at 10-15-20 points gain.

So here’s a bonus trade for all website visitors:
We can buy Emini futures at 2163 for 2197 target with 2150 stop.

Emini Futures Trading Update – 26Aug2016

sp500-emini-futures-weekly-chart-26aug2016

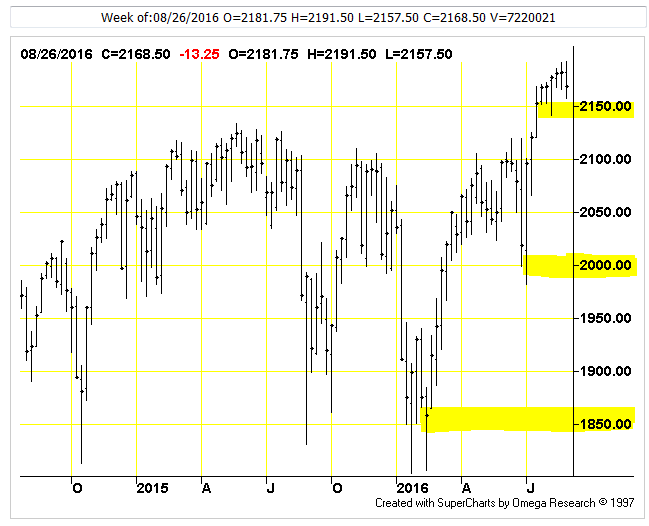
Here is the weekly chart of S&P500 Emini futures. The current upside target is 2200. The 3 major support levels are marked in yellow. They are at: 2150, 2000, 1850. As you will observe, they are at a gap of 150 points each. We can hold long positions with 2150 as stop. Between 2150 and 2100, its a zone of indecision and we can avoid long or short trades. Below 2100, we can sell Emini futures for targets of 2020 with stop of 2120. If the index goes into a correction mode, we have to wait aside for the fall to stop and a green week to come, which will indicate larger buyers are stepping in. Only then, we can consider new long positions in Emini futures. Thanks.


S&P500 Futures Monthly Chart Analysis – 29July2016

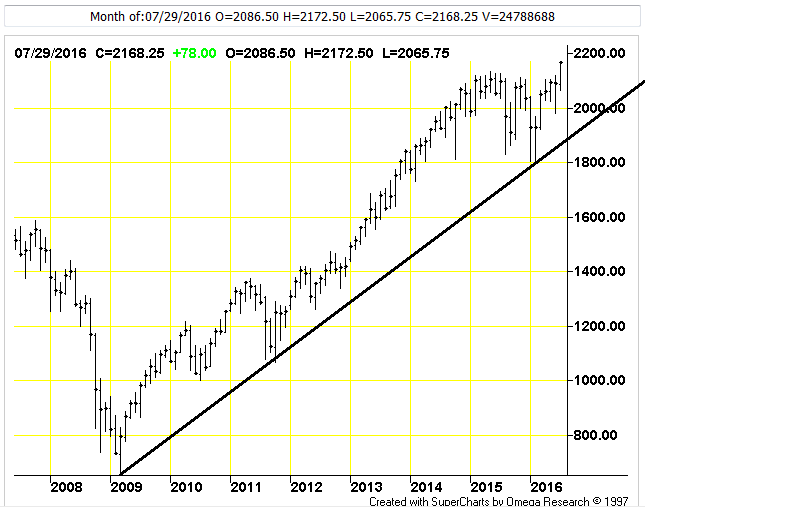
Following is the S&P500 Futures Monthly Chart over last 10 years from August 2017 to July 2016. The S&P500 index futures have been moving up firmly on the support of a long term trend line since March 2009. Like all trend lines, this trend line will also break one day, and open the way for larger downside. We don’t know when that will happen, so we have to trade with cautious, every time we bounce away from the trend line because there is a strong tendency to revert back to it, which is currently at 1900, or 265 point behind. sp500-futures-monthly-chart-29july2016

On the upside, 2200 is a reliable target, and it can come in August if some major bad news does not come. As mentioned previously on this website, our strategy for year 2016 has to been to stay long above 2000, and that has worked well, and we have 165 points gain on the positional trade, which has been done in several parts over last 4 months. August is a month of high volatility and we have to be cautious.