Emini Futures Trading Analysis- 17Oct2017

Hello Folks, the S&P500 Emini futures at 2556.75.
Today’s Range: 2552.25 – 2557.75
Please note the trade modification.
Trade#1 of Oct 2017 (updated target)
————————————————————–
Buy Emini Futures at 2552 for Target 2572 with Stop loss 2540.
————————————————————–
(Note: This trade was completed successfully on Oct 20, with 20 points gain)

The futures have moved well today. They showed strength despite intraday weakness. I saw the futures at 2553 in the morning, and was thinking that a close below 2550 will be negative, and a close above 2556 will be positive. The last several days of small narrow range days have set the stage for big move now. As stated yesterday, the probability of upmove is higher because the futures have been holding up above 2550. However, for any reason, if they go below 2550, then fresh selling can rapidly take the futures down to 2530-2535. Continue reading →
Emini Futures Trading Analysis- 06Oct2017

spx500-futures-weekly-chart-analysis-06oct2017

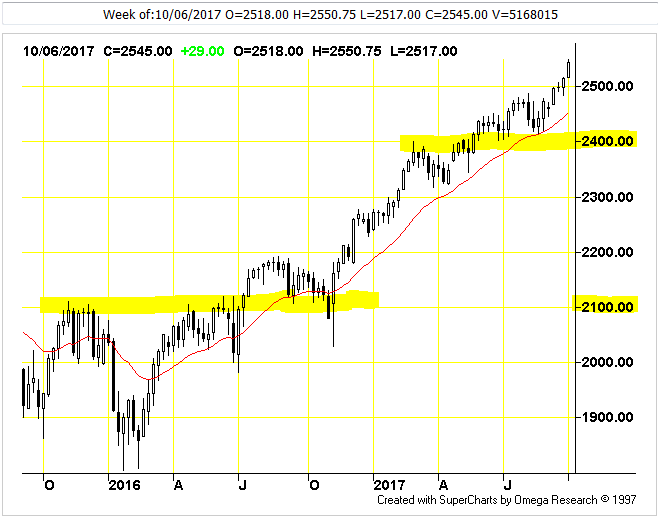
Moving Average Indicator: The S&P500 Emini futures have been consistently above the 20 week moving average, so the trend is clearly up and the market will be strongly bullish above 2500 level.

Momentum Indicator: Momentum (75) is above zero, indicating an overbought market. The long term trend, based on a 45 bar moving average, is UP. The short term trend, based on a 9 bar moving average, is UP. Momentum is indicating an overbought market. However the market may continue to become more overbought. Given the 45 bar new high here this is even likely. Look for some evidenced weakness before getting too bearish here. Continue reading →

Emini Futures Trading Analysis- 29Sep2017

spx500-futures-weekly-chart-29sep2017

The S&P500 Emini Futures have closed at 2516 on Friday Sep 29, 2017, which is a new lifetime high for weekly closing. Following is our technical analysis of the weekly chart.

Moving Average Indicator: The market is very bullish because the fast moving average is above the slow moving average. Everything in this indicator is pointing to higher prices ahead.

Momentum Indicator: Momentum (46.50) is above zero, indicating an overbought market. The long term trend, based on a 45 bar moving average, is UP. The short term trend, based on a 9 bar moving average, is UP. Momentum is in bullish territory.upside move is likely. And, the market put in a 45 bar new high here. More highs are possible.

Rate of Change (ROC) Indicator: Rate of Change (1.88) is above zero, indicating an overbought market.The long term trend, based on a 45 bar moving average, is UP. The short term trend, based on a 9 bar moving average, is UP. Rate of Change is in bullish territory. And, the market put in a 45 bar new high here. More highs are possible. Continue reading →

Emini Futures Trading Analysis- 08Sep2017

spx-500-futures-daily-chart-analysis-08sep2017

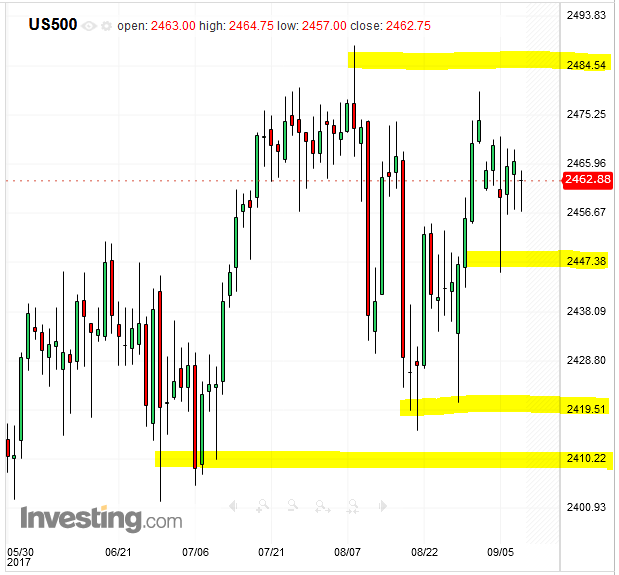
The S&P500 Emini Futures are currently at 2463. The futures have been testing various support levels like 2410-2420 to 2440-2450 over the last 2 months, and they are preparing for a fresh attempt to cross 2480. Previous attempt failed and the futures fell nearly 70 points from 2488 till 2420. So the futures are taking their time in testing all support levels in order to launch a fresh attempt to cross 2480 and go towards 2500.

There is a solid resistance/ selling pressure at 2480-2483 level, and it will need a strong push to cross it. There can be no room for selling pressure around 2483 otherwise 30-40 points will be loss rapidly, and all the effort in creating longs will be wasted again. Such an effort may happen in the next 1-2 weeks.

[Bonus Trade]
Buy S&P500 Emini Futures at 2463 for Target 2483 with Stop loss 2443.

Emini Futures Trading- Performance Summary Aug2017

Hello Folks, here is the Performance Summary for Aug 2017. We usually don’t publish trade wise details but August 2017 was particularly unique in how the trading results were different for two different trading styles, so we wanted to share them as an example, which can help all traders learn from our experience, and become better traders.

We have two types of trades.
(a) General Trades – suitable for all traders including those with just 1-2 contracts, and we measure our monthly performance on these trades. Only one trade is on at a give time.
(b) Optional/Tactical Trades – meant for larger traders with 5-10 or more contracts who can buy/sell 1-2 contracts at multiple market levels and exit them with 10-15 points gain. Multiple trades can be on at a give time. These are less reliable set ups, so the chances of getting hit with 10 point stop loss is 50-50 in many cases,  but we have learned from experience that such trades can be profitable in a volatile market and also in a market that is reversing after testing supports. Continue reading →