Emini Futures Trading Analysis- 23Mar2018

spx500-futures-daily-chart-analysis-23mar2018

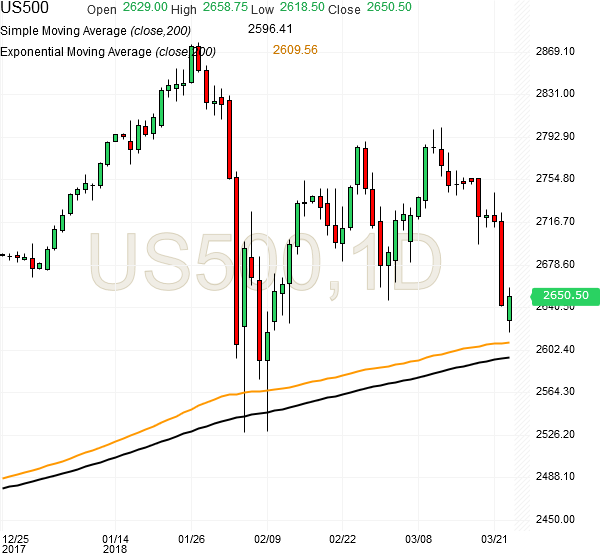
Hello Folks, the Emini S&P500 (ES) futures are at 2650. The futures broke their support at 2650 yesterday and went down till 2620 today morning, and have recovered from there back to 2650. However, 2600 is most likely to be tested once before any reversal, because the 200 day SMA is at 2596 currently, and the 200 day EMA is at 2610 currently. So the futures will most likely test 2600 level today or in the next couple of days before we can expect a reliable reversal.

We can expect a reversal from 2600 towards 2700 because the fundamentals of S&P500 companies are in good shape. But its very rare to see a reversal without testing the 200 day SMA when the index is so close to it. Strong support is at 2580, which should hold this time. Resistance is at 2680 and 2780. Please see the attached chart. Continue reading →

Emini Futures Trading Update- 22Mar2018

spx500-futures-daily-chart-analysis-22mar2018
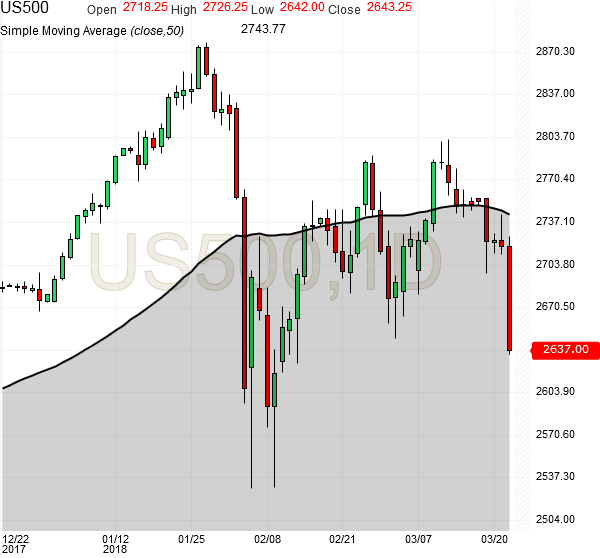
Hello Folks, the S&P500 Emini futures are at 2637.00
Today’s Range: 2634.25 – 2726.25

Today has been a very tough day in the market, as stop losses have cascaded from 2700 to 2650, and trading algos of large fund houses are pumping shorts, while buyers are standing back to understand the situation. This has happened a few times before in last 5 years, including in Jan-Feb 2016. The trading algos reverse their trading from short to long in a second as they have no capital shortage, but we humans take time to get back.

Today is a melt down in the market with stop losses, with nearly 100 points fall in one day! The futures recovered from 2665 to 2690 and then fell again, causing further damage to newly created longs at 2670-2680. Such double hits are very rare within a day. The index is trading is large range, and that is why we have reduced our position size / number of contracts. Continue reading →

Emini Futures Trading Analysis- 05Mar2018

spx500-futures-daily-chart-analysis-2681-05mar2018

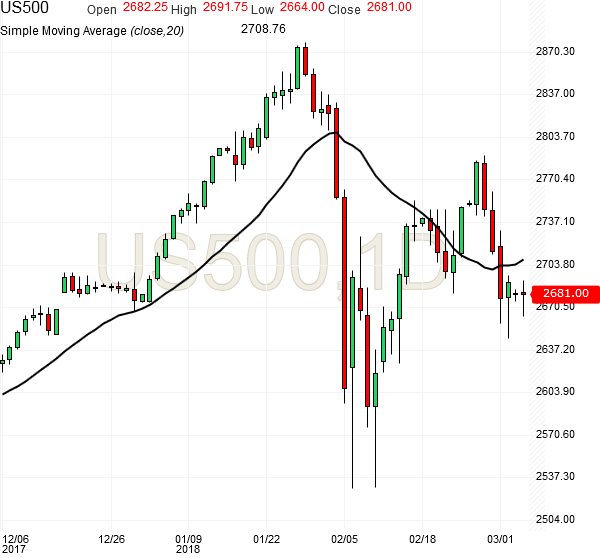
The futures are on the defensive at 2681, being below 20 day SMA, but they have the support of a good defense done at 2650 level just 2 days back. So the current move at 2670-2680 maybe seen as support level testing. The sharp cut will come below 2650, so all long positions should have 2650 as the Stop loss. Long positions can be maintained above 2650 for target 2730. A reliable long trade will come above 2710.

[Bonus Trade] Buy S&P500 Emini Futures at 2680 for Target 2700 with Stop loss 2660.
That’s 20 points gain with 20 point stop loss.

Emini Futures Trading Analysis- 02Mar2018

spx500-futures-weekly-chart-analysis-02mar2018

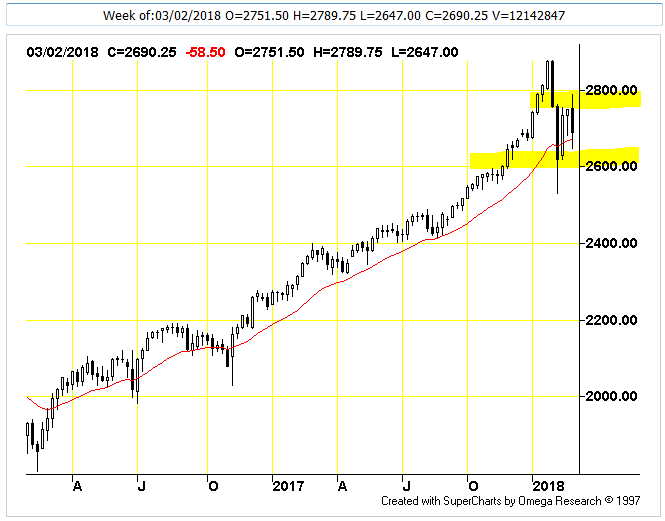
The futures have bounced back from 2650 this week, and closed above 2673, which is the 20 week SMA. There is clear resistance at 2780 level. The futures are testing lower level support levels of 2600-2650 and recovering from those levels, which is a positive sign. The S&P500 Emini Futures have shown support at 2650 and resistance at 2780 – that’s the trading range for coming week. Many technical indicators are saying that this fall is over, and the market will now prepare for the next upmove towards new highs of 2900-2950 in the coming weeks/months. However, 2600-2650 maybe retested and 2500 can also come if 2600 breaks down. Therefore, any major long positions should be created above 2700 with 2680 as stop loss.

[Bonus Trade] Buy S&P500 Emini Futures at 2670 for Target 2710 with Stop loss 2650.
That’s 40 points gain with 20 point stop loss.

S&500 Futures Weekly Chart – Technical Analysis
Date: Friday, March 02, 2018

Moving Average Indicator: Price is above the moving average so the trend is up. In the short term, the market is bearish because the fast moving average is below the slow moving average. Even though based on conventional interpretation the market is technically bearish, we will not classify it as extremely bearish until the following occurs: the slow moving average slope is down from previous bar. In the long term, the market is bullish because the fast moving average is above the slow moving average. Even though based on conventional interpretation the market is technically bullish, we will not classify it as extremely bullish until the following occurs: price goes above the fast moving average, price goes above the slow moving average.

Bollinger Bands Indicator: The Bollinger Bands are indicating an oversold condition. An oversold reading occurs when the close is nearer to the bottom band than the top band. Volatility appears to be declining, as evidenced by a decreasing distance between the upper and lower bands over the last few bars. The market appears oversold, but may continue to become more oversold before reversing. Look for some price strength before taking any bullish positions based on this indicator.

Commodity Channel Index (CCI) Indicator: CCI (33) is in neutral territory. A signal is generated only when the CCI crosses above or below the neutral center region. CCI often misses the early part of a new move because of the large amount of time spent out of the market in the neutral region. Initiating signals when CCI crosses zero, rather than waiting for CCI to cross out of the neutral region can often help overcome this. Given this interpretation, CCI (33) is bullish, but has begun showing some weakness. Begin looking for an attractive point to liquidate long positions and return to the sidelines.

RSI Indicator: RSI (54) is in neutral territory. This indicator issues buy signals when the RSI line dips below the bottom line into the oversold zone; a sell signal is generated when the RSI rises above the top line into the overbought zone. RSI is somewhat overbought (RSI is at 54). However, this by itself isn’t a strong enough indication to signal a trade. Look for additional evidence before getting too bearish here.

MACD Indicator: MACD is in bearish territory, but has not issued a signal here. MACD generates a signal when the FastMA crosses above or below the SlowMA. The long term trend, based on a 45 bar moving average, is UP. The short term trend, based on a 9 bar moving average, is DOWN. MACD is in bearish territory.

Slow Stochastic Indicator: The stochastic is bearish because the SlowK line is below the SlowD line. The long term trend is UP. A good upward move is possible without SlowK being overbought. However, a down move in SlowK for this bar is a little concerning short term.

Disclaimer: The above analysis is meant solely for the understanding of technical analysis of the S&P500 index futures. It is not meant to provide any investment advice.


Emini Futures Trading Report- 08Feb2018

spx500-futures-hourly-chart-analysis-2597-08feb2018

Hello Folks, the S&P500 Emini futures at 2597.25
Today’s Range: 2577.75 – 2686.50

The futures did not reach 2660 after hitting our stop at 2650 in the
morning, though they crossed 2650 a couple of times, and then went down to
2600 after 2650 level failed. Therefore, our 2660 limit buy order did not
execute, and our futures long position did not re-establish today.
Currently we are on the sidelines, and will get back on board at 2660.
The upside targets are 2750, 2780, 2800 and they may come by end Feb.

Market Notes:

1. We have taken stop losses this month, and we have to recover them, and
we will do it. This is not the first time the market is falling, and we
have come out successfully from similar situation in Jan-Feb 2016. The
corrections of 2017 were minor compared to this one in Feb 2018.

2. There were multiple reasons for our choice of 2650 stop. It was a
support in that past, from which the rally took off. And on the hourly
chart, there is a head and shoulder formation, with neck line at 2650, so
below 2650, a quick fall was visible, which played out today.

3. It maybe difficult to believe looking today’s fall, but my analysis is
that the fall is over, and today was a follow up test of support levels,
to ensure all lower levels get tested in one shot. The same could have
been done at 2650, but the futures wanted to test lower like 2580. The
futures might fall further till 2550 briefly and bounce back from there.
Few months back, 2580 was a strong resistance and then it became a strong
support. I am confident 2580 will hold, and futures will bounce back up.

4. The S&P500 is falling more on lack of buyers than on selling pressure.
I believe the large funds managers are busy deciding at what level they
want to buy. This market is still a buy on dips market, the current fall
is setting the stage for next rally.

5. Similar falls of this type in the previous 5 years have taken 3-5 weeks
to build the base for the next upmove. It doesn’t look like the futures
will close above 2700 this week. Therefore, new highs of 2900+ may come
only in March or April, because it will take the futures 2-3 weeks to
build the base before moving up again. However, 2750 and 2800 are still
our targets for end Feb 2018.

6. There has been record high leverage in the market due to less
volatility and relatively good gains in year 2017. Some of those leveraged
positions will get cut in this fall, which will make the market stronger.

7. A couple of traders/investors asked me if this was a rewind of 2008
fall, which started in Jan 2018, and went on crushing prices lower till
year end. My analysis is that we are not at all in 2008 kind of scenario,
which came after 4-5 years of economic growth worldwide, and recession
data points were already visible on the dashboard. We don’t have such a
condition today, and global economic growth is just starting to picking
up, still weak in many places. We can expect new highs in S&P500 this
year, in the coming weeks and months. Thanks.