Emini Futures Trading Analysis- 30Dec2019

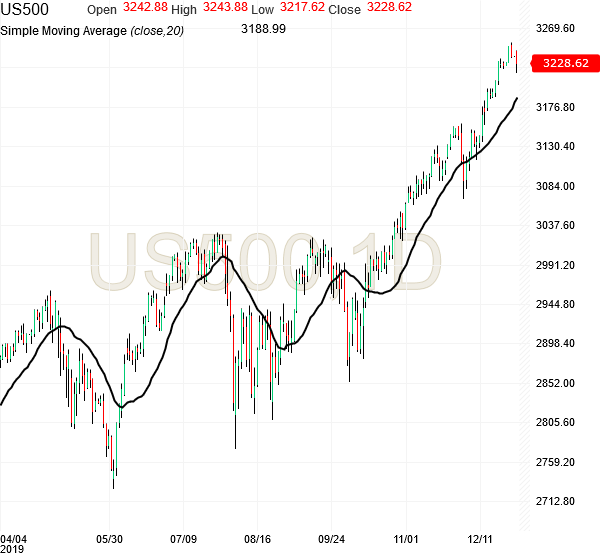
Hello Folks, the S&P500 futures are at 3228.50
Today’s Range (so far): 3217.50 – 3244.25

For the last 10 days, we have been seeing weakness in momentum indicators, while price was moving up, and that was not a reliable setup at all. Since 27th Dec 2019, the futures hit a high of 3553 and started correcting, in line with the weakness in short term daily momentum.

sp500-daily-chart-analysis-30dec2019

In the daily chart below, we have we can see that the 20 day moving average has not been tested in a while now, so there probably at testing of that support level coming up in the next 1-2 weeks. If it holds, we will see next leg of the rally, and if it fails, where we may see correction till 3100 level. We have to be cautious below the 20 day moving average.
sp500-daily-chart-analysis1-30dec2019

But today is 30th Dec 2019, and we have far more important things at hand!! Unless we have a 50-100 points move tomorrow on 31st Dec 2019, the following yearly chart of S&P500 index will look the same at the end of year 2019. This is a very valuable chart, because it gets drawn only once per year, at the year end! So please save this post.

sp500-yearly-chart-analysis1-30dec2019

S&P500 Futures Technical Analysis – on Yearly chart:

  • The above chart has trend line analysis of the S&P500 index yearly chart, and we see a strong band of support between 2600-2800, which should provide support during any major sell off, if it happens.
  • The two white arrows indicate the two important support levels for year 2020, and they are: 3000 and 2700.
    • 3000 is the anchor for the current upmove, and please remember that 3020 acted as a major resistance for several months, and now that is a major support. Regular market weakness will not be able to break 3000 level.
    • 2700 is the dire straits, deep low for the S&P500 for year 2020. 2740 is a major support level. It may not come at all. If it comes, it must be used for buying with a reasonable stop loss.
  • The battleground in year 2020 will be between 2900-3000 level, because if that zone is defended successfully, then new highs can come high reliability and without a sell off at the new higher levels.
  • Below 3000, the futures will search for support and we will see big swings and higher volatility, like what we saw in May 2019 around 2700 level, and Aug 2019 around 2800 level.
  • 3000 is the most important level for 2020. It is likely to get tested at least once, if not a couple of times. Above 3000, the S&P500 is in strong uptrend.
    • 3370 is upside Target#1 for 2020. It will come for sure, maybe within Q1,2020.
    • 3480 is upside Target#2 for 2020. It will come for sure. Whether it comes without a correction to 3000, or after a correction to 3000, is not clear yet.
    • 3600 is upside Target#3 for 2020. The path for this target is not clear yet. We will deal with it in real time.

Our S&P500 Emini Futures Trading Strategy for year 2020 is to constantly look for long trades – those are the winning trades, and the market has rewarded our view again and again! Our default trading strategy will be stay long above 3000 level, with a 20 point stop loss at 2980. This trade worked multiple times in year 2019 as well.

Overall, we can expect a green year in 2020, given the quality of the yearly setup. Because 2020 is also US Presidential Election Year, lots of noise will be there, and it can create volatility during the year. We should use such corrections to buy.

Please remember that America is much much bigger than any individual or group of individuals. The enterprising and hard working nature of American people (and also the bright people worldwide, because about 50 percent of S&P500 sales and income are now coming from outside the USA) is at the core of the S&P500 index rally over last 60 years. The growth of S&P500 is not dependent on anyone, and its growth can not be stopped, even if it’s blocked with hurdles briefly. It is important to remember this point even more during a market downturn, than during a nice green rally. I have learned over the last 15 years that we get best trading results by just focusing on the price action of S&P500 futures (daily and weekly charts), rather than business news media -because they have no commitment to get you profits, but I have. Hence this post!

Even if you are not a member/subscriber of our Trading Group, you can still benefit from the regular posts with S&P500 futures analysis, market direction, and bonus trades, which are published often, to help everyone visiting our website. Thanks.
Wishing you Happy New Year 2020!
Emini Futures Trading Analysis- 25Dec2019

Hello Folks, Wishing you Merry Christmas and Happy New Year!!
May God bless you with great health, success and happiness!!

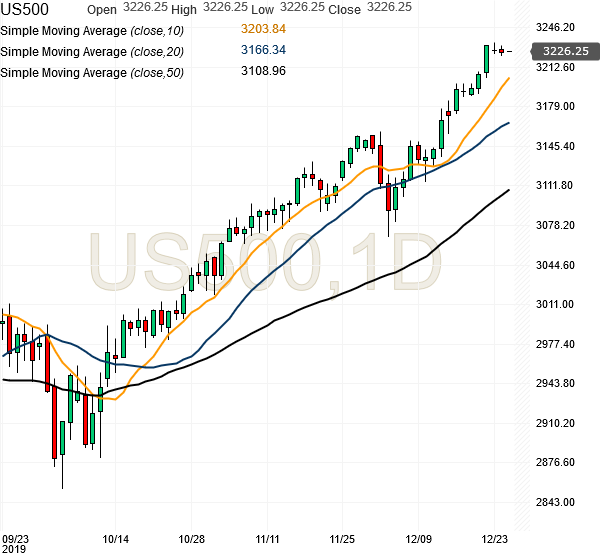
The #SP500 futures are at 3226. They have done a strong upmove in last few weeks. As mentioned multiple times in previous posts, we must stay long above 3000, and that has already given 200+ points gain.

The uptrend which started on 10 Oct 2019 is still intact, but there will be some inevitable profit taking that will come on any negative news. Therefore, at current level, we should take profits and have fewer long positions. 3200 is the absolute stop loss or cut off for any long trade at current level.

spx500-futures-daily-chart-analysis-25dec2019

The monthly chart of SP500 futures is still bullish, and we may see further upmove in Jan 2020, but we can consider new trades for Jan 2020 once we are there. So we should be cautious, but maintain long view above 3200. Above 3220, the target is 3250.

Here’s a Bonus Trade:
“Buy at 3223 for Target 3249 with Stop loss 3200.”
Please Note: This trade has 50-50 chance of success, so it’s meant as an Optional Trade with 1-3 contracts for larger traders with surplus capital that is currently idle after profit taking. If you are trading with 4-5 Emini Contracts, you could try this trade with 1 contract. If you are trading with less than 4 Emini Contracts, then this trade is not suitable for your case. Its better to wait for more reliable setups.

spx500-futures-monthly-chart-analysis-25dec2019

Last year on 25 Dec 2018, the market was absolutely bearish (and we kept buying at the low levels to the extent possible, because a good rebound was sure from such low levels) and indeed things turned around in Jan 2019. And today on 25 Dec 2019, the market looks absolutely bullish, with very high (near record) levels of optimism by investors and traders and record high activity in Call options. Such situations usually don’t give good gains in the short term.

The major support is at 3020 level, which is 200 points down from current level. That 3020-3030 level was a major resistance earlier and it took several attempts to cross it, so now it will provide strong support.

Year 2019 has given one of the best gains in last 20 years, and we can’t expect such years again and again. The market will have to absorb these gains, which will require some consolidation, so we may see prices trying to consolidate around 3000-3200 in the coming year 2020. Year 2020 is also a US Presidential Election Year, so there will higher volatility, especially in H2, 2020. We will need to work with tight stop losses and clear targets in all our trades, and we must remain very alert and agile. Thanks!

Emini Futures Trading Analysis- 16Dec2019

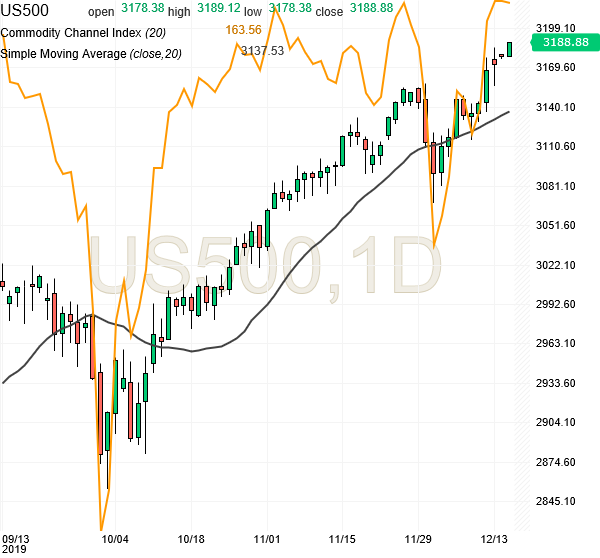
Hello Folks, the S&P500 futures are currently at 3190.00
Today’s Range (so far): 3177.00 – 3191.25

The futures have moved up on positive news regarding US-China trade deal. However, the futures are now in overbought zone, and we can see quick 20-30 point correction on any negative news. The resistance at 3180 has been crossed but really tested, so the current setup does not have a clean trade. So there is no new General Trade currently. We have to wait and watch.

The S&P500 trend is clearly up, and buying on correction is the profitable S&P500 futures trading strategy, while the futures are above 3000. The immediate support is at 3120-3140 level, and upside target is 3220, which is 30 points above current price of 3190. The S&P500 futures are facing stalling momentum, and they may try to test 3150-3160 levels by next week.

spx500-futures-daily-chart-analysis-16dec2019

Traders with 10+ contracts: Here is an Optional Trade with 1-2 contracts.
“Buy at 3190 for Target 3210 with Stop loss 3170”
This trade has 50-50 chance of success and its not suitable for all traders.

At the start of year 2019, when the futures were near 2500, we had given our yearly target as 3000, which came long ago, and we have made good gains this year using 3000 as constant upside target, buying all corrections towards 2800. Now, we should remain cautious at current level of 3190. Thanks.

Emini Futures Trading Analysis- 05Dec2019

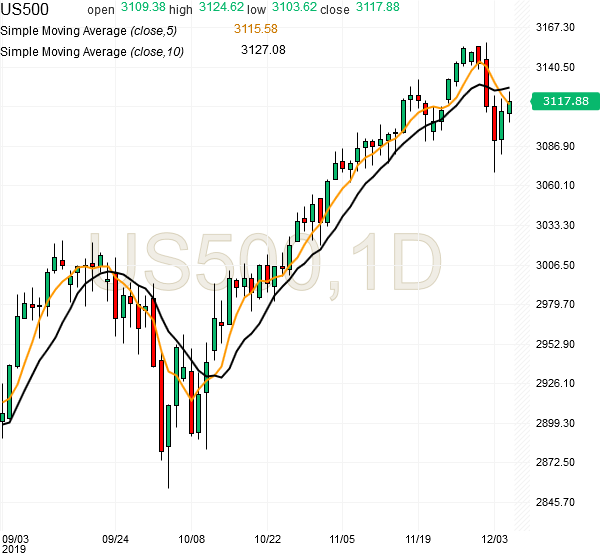
The S&P500 futures are currently at 3117 at the time of market closing, which is a good recover from day low of 3103 levels. As mentioned in earlier posts, the futures will be bullish above 3100. And sharp bounces from near 3100 indicate buying strength.

The futures will tend to become safe above 3130, but there is also a strong resistance at 3140, so we want to see how the futures navigate the 3140 level. Above 3150, the next major targets are 3180 and 3200.

Our Emini Futures Trading Strategy for Dec 2018, is to stay long, because the S&P500 index is in strong uptrend.

Here’s a Bonus Trade for our website visitors:
“Buy at 3128 for Target 3143 with Stop loss 3114”

spx500-futures-daily-chart-analysis3-05dec2019

spx500-futures-daily-chart-analysis2-05dec2019

spx500-futures-daily-chart-analysis-05dec2019

Emini Futures Trading Analysis- 04Dec2019

spx500-futures-daily-chart-analysis-04dec2019

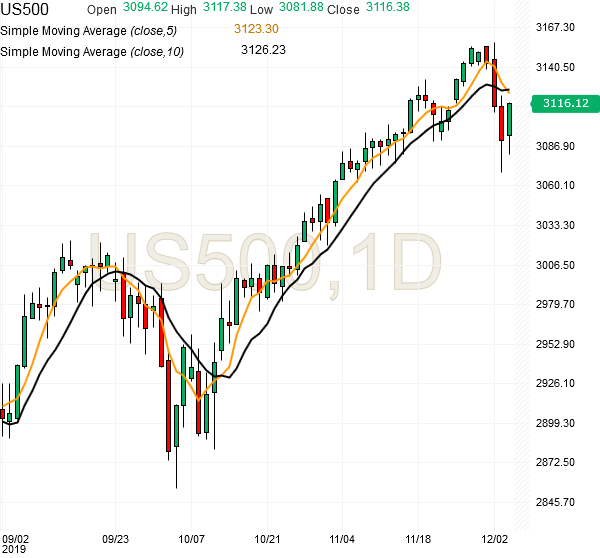
Hello Folks, the S&P500 futures are currently at 3116.00
Today’s Range (so far): 3081.75 – 3117.25

The futures have recovered more than 40 points from their low yesterday at 3070, and they also have successfully tested the key support level of 3070-3075 yesterday. But we may see one more testing of the 3080 support level, before any real upmove again, because it is very important to be sure that this 3070-3080 support level is intact.

If 3070 support holds, then the futures bounce back above 3100 rapidly, and the next major target is 3180, with major resistance at 3140. So all long trades should be closed around 3140, and one can start new long trades above 3155-3160 to be sure that that the 3140 resistance level has been taken out. Continue reading →