Emini Futures Trading Analysis- 17Dec2018

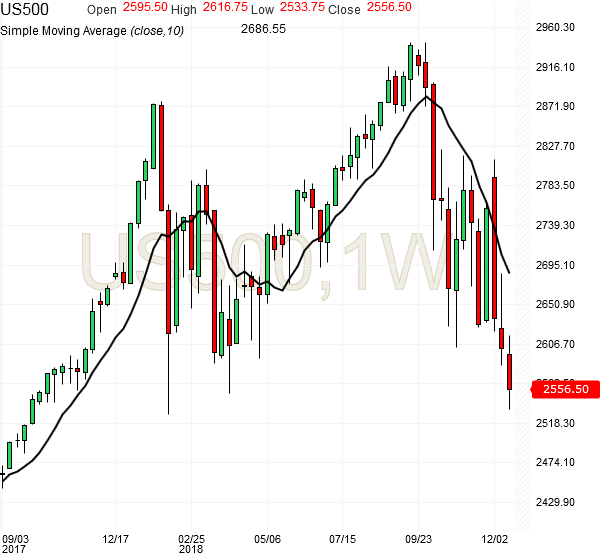
Hello Folks, the S&P500 Emini futures are currently at 2555.50, down 50 points for the day. Following are three weekly charts taken at different points of the day today. This is the third red week, and the selling looks mostly done. The futures have tested lower support level of 2530 today, and the futures bounced back from 2530 level, which was the support level established in Feb 2018. The futures are oversold currently, and we can see a good recovery of 100 points to 2650 by December end.

sp500-futures-weekly-chart-analysis-17dec2018

sp500-futures-weekly-chart-analysis-17dec2018-2sp500-futures-weekly-chart-analysis-17dec2018-3

There is a fear in the market that the US Fed will give hawkish message for interest rates in 2019, but I am not sure about that, given the data points about global economic growth slowing down in parts, and crude oil is reflecting those data points. But that fear and the correction seems overdone for now. Investors should expect recovery in S&P500 over next 2-3 weeks.

[Bonus Trade] In my view, the S&P500 will retest its 200 day moving average at 2765 before end-Jan 2019. That is 200 points above the current price of 2555, which presents a good upside for both traders and investors.

Emini Futures Trading Analysis- 02Nov2018

Hello Folks, the S&P500 Emini futures are at 2711.75
Today’s Range: 2699.75 – 2765.75

spx500-futures-minute-chart-analysis2-02nov2018

The futures have dipped below 2700 till 2699.75 in a slow manner, and bounced back sharply from there, indicating that the 2700 support level is holding. Therefore, we will get back our futures lost in the Optional trade of today.

Traders with 10+ contracts: Here’s next Optional trade with 2-3 contracts.
“Buy at 2710 for Target 2745 with Stop loss 2690”

There is no General Trade – the volatility is back, and giving some joy to VIX traders. But we need 2700-2710 levels to get tested again, which will happen today and over the weekend. We may get a suitable setup on Monday. However, if the futures go down to 2680 today, then it will become a good buying opportunity. Please stay alert till market close today. Thanks.

—————————————————————————————–

Hello Folks, the S&P500 Emini futures are at 2713.00
Today’s Range: 2611.75 – 2765.75

We had said on 30th Oct, when the futures were at 2680 that 2750 is a reliable upside target for Nov 2018. And the futures have hit 2750 today itself, which is 2nd Nov. But the futures have corrected sharply after hitting 2766 high today, with 50 points intraday correction, which looks bearish as of now just for the next 1-2 days. The futures have also reacted down from their 200 day SMA, which is not positive, because the goal was to cross the 200 day SMA without major hurdles. The upside trend has appeared firmly in weekly charts, so we need a position to go long, and current position is 50-50, hence not suitable for a general trade.

Traders with 10+ contracts: Here’s an Optional trade with 2-3 contracts.
“Buy at 2715 for Target 2745 with Stop loss 2700”

The support level is strongly in place at 2700, so we may try to take a trade using that support level.
If the futures can hold the 2700 support level, then this is the point of highest risk reward with upside target of 2750 again next week.

[Bonus Trade] This can be done by traders having 1-2 contracts.
“Buy at 2705 for Target 2730 with Stop loss 2690”

spx500-futures-daily-chart-analysis2-02nov2018

spx500-futures-daily-chart-analysis1-02nov2018

spx500-futures-weekly-chart-analysis-02nov2018

Emini Futures Trading Analysis- 30Oct2018

spx500-futures-30min-chart-analysis-30oct2018

Hello Folks, the S&P500 Emini futures are at 2688 currently. We are are in prime buying zone now, and we need one more confirmation in order to start a 30-50 point trade on the long side.

The futures had failed to hold above the 200 SMA line couple of days back and that caused major damage by the sharp 100 point intraday correction from 2707 to 2603. And now the futures are back above the 200 SMA line, and that indicates strength. This strength will get confirmation when the futures cross 2691, which is the resistance trend line currently.

The trend has reversed to upside, and our Emini Futures Trading Strategy is to stay long above 2670.

[Bonus Trade] Buy at 2695 for Target 2730 with Stop loss 2680.

Emini Futures Trading Analysis- 09Oct2018

spx500-futures-daily-chart-analysis-09oct2018

The S&P500 Emini futures are at 2889.00
Today’s Range: 2874.50 – 2900.00

The futures are testing 2880 level again today, and it also now coincides with the 50 day moving average. Please see the chart. The futures have made a higher high and higher low today, compared to yesterday, which is positive. The futures must close above the 50 day moving average, otherwise downside risk increases rapidly over next 2-3 days.

There is no trade as of now, but today is important and futures must close around 2890 for a chance for upmove by eod Friday. Closing below 2885 will be bearish in the near term, and this is October month – so we need to be extra cautious.
The futures have some work to do here at 2888, and they have to move up above 2900. A suitable long trade in the current market may come at/above 2900, with target 2930, and 2880 as stop loss. Thanks.

Emini Futures Trading Analysis- 10Sep2018

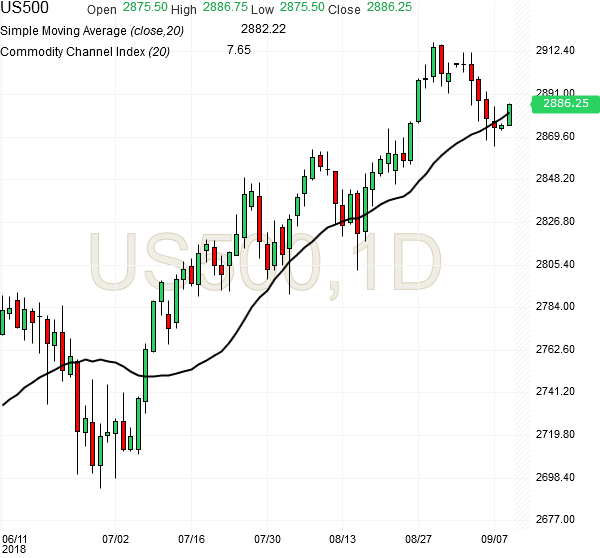
Hello Folks, the S&P500 Emini Futures (ES) are currently at 2885. They have moved back above 2880, which was the breakout level two weeks back, and that’s good news because the futures become safe above 2880.

spx500-futures-daily-chart-analysis-10sep2018

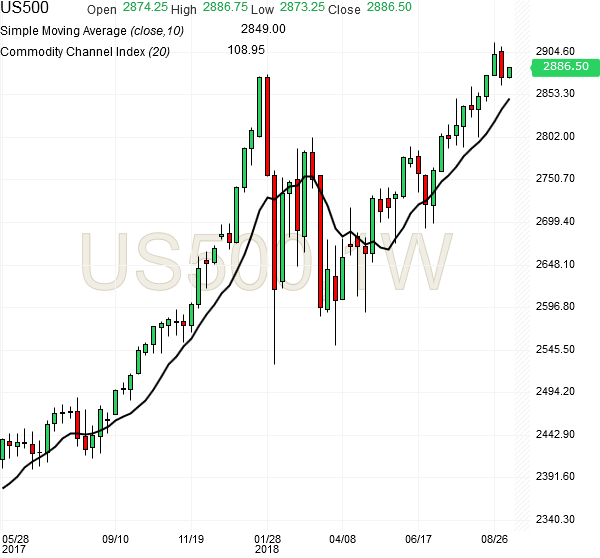
The S&P500 index trend is up, and new long trades can be considered from here onwards, though high reliability long trades will come above 2900. Any long trade at these levels needs 15-20 points stop loss. There is a support at 2850, visible on the weekly charts. However, the major support is at 2800, and any sharp correction will may only stop at 2800-2810 level. So there is some downside in this market, unless bullish moves start asap. Traders must avoid longs below 2880. Today’s moves are looking positive, where the index has come back above its 20 day moving avg.

spx500-futures-weekly-chart-analysis-10sep2018

Our Emini Futures Trading Strategy is to go long above 2880. Upside targets of 2930-2950 are visible now, if 2880 level holds. Below 2880 level, major losses can come rapidly

[Bonus Trade] Buy at 2885 for Target 2900 with Stop loss 2870

Market view: Trade wars and global currency swings are a slippery slope, and sometimes, big negative events have happened in such conditions, so the market is right in being cautious, because the investors are taking risk at current higher-end market valuations and betting on stable economic conditions.

Most large corrections have been in the fall, when the chill winds of the fall season, erase the holiday cheer of the summer, and people are forced to look at the things in a clear way. So we should be careful in September and October. If these two months go without major damage, then we may see new highs on S&P500 by year end in Dec 2018. Thanks.