Emini Futures Trading Update- 29May2018

Hello Folks, the S&P500 Emini futures are at 2700.50
Today’s Range: 2690.25 – 2724.25

Today early morning, the futures have hit stop loss 2704 in Trade#8.
There is no new general trade as of now, and I will mail you shortly after market analysis.

The futures fell by nearly 30 points in early morning trade, before US markets opened, and went down till 2790. They were unable to cross 2740 last week, and kept coming back to 2720 level, after defending 2704 level, which was our stop loss.

As the futures have bounced back to 2700 again may mean that the fall of today morning was not meant to breakdown the 2700 support level. Our Emini S&P500 Futures Trading Strategy is to stay long above 2700 for targets of 2780-2800. That has not changed. S&P500 Futures Technical Analysis indicates strong support at 2680, and major weakness below 2680 for lower targets of 2600-2630. However, since the futures have tested 2600-2630 level multiple times in last 2 months, that scenario has less probability as of now.

Traders with 5-10+ contracts:
Here are two new optional optional trades with 1-2 contracts each.
(k) “Buy at 2700 for Target 2720 with Stop loss 2690.
(l) “Buy at 2700 for Target 2730 with Stop loss 2680.

[Bonus Trade] For all our website visitors and traders.
“Buy at 2710 for Target 2730 with Stop loss 2700.”
This trade will activate at 2710, which is about 10 points above the current price of 2700. Thanks.

Emini Futures Trading Update- 28Mar2018

spx500-futures-chart-analysis-28mar2018Hello Folks, the S&P500 Emini futures are at 2610.00
Today’s Range: 2593.00 – 2633.50

The futures are holding above 2600, which is positive for now. Yesterday, they fell below 2600 twice and in between bounced up above 2630 and again fell back to 2600, hitting our absolute stop loss at 2600. The futures went above 2630 briefly, which is the safety zone, but fell back to 2600. The market has been more volatile than I expected because futures have come back to their 200 day SMA after testing it just 2 days back, which is very uncommon, and we got a cascade of stop losses till 2593.

We had a high quality set up at 2650, which hit stop loss at 2630. And unfortunately 2630 was picked up in the bounce from 2600, and that breakout failed. That breakout setup at 2630 came for the first time after 07 March 2018, after nearly 3 weeks, so we trusted it, like many others, but it failed. There is enormous stress in the market currently, and 2600 is the last point of long trade. Continue reading →

Emini Futures Trading Update- 22Mar2018

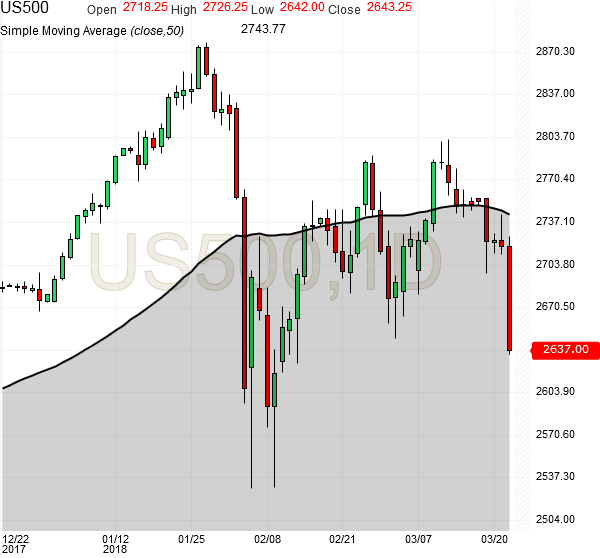
spx500-futures-daily-chart-analysis-22mar2018
Hello Folks, the S&P500 Emini futures are at 2637.00
Today’s Range: 2634.25 – 2726.25

Today has been a very tough day in the market, as stop losses have cascaded from 2700 to 2650, and trading algos of large fund houses are pumping shorts, while buyers are standing back to understand the situation. This has happened a few times before in last 5 years, including in Jan-Feb 2016. The trading algos reverse their trading from short to long in a second as they have no capital shortage, but we humans take time to get back.

Today is a melt down in the market with stop losses, with nearly 100 points fall in one day! The futures recovered from 2665 to 2690 and then fell again, causing further damage to newly created longs at 2670-2680. Such double hits are very rare within a day. The index is trading is large range, and that is why we have reduced our position size / number of contracts. Continue reading →

Emini Futures Trading Report- 08Feb2018

spx500-futures-hourly-chart-analysis-2597-08feb2018

Hello Folks, the S&P500 Emini futures at 2597.25
Today’s Range: 2577.75 – 2686.50

The futures did not reach 2660 after hitting our stop at 2650 in the
morning, though they crossed 2650 a couple of times, and then went down to
2600 after 2650 level failed. Therefore, our 2660 limit buy order did not
execute, and our futures long position did not re-establish today.
Currently we are on the sidelines, and will get back on board at 2660.
The upside targets are 2750, 2780, 2800 and they may come by end Feb.

Market Notes:

1. We have taken stop losses this month, and we have to recover them, and
we will do it. This is not the first time the market is falling, and we
have come out successfully from similar situation in Jan-Feb 2016. The
corrections of 2017 were minor compared to this one in Feb 2018.

2. There were multiple reasons for our choice of 2650 stop. It was a
support in that past, from which the rally took off. And on the hourly
chart, there is a head and shoulder formation, with neck line at 2650, so
below 2650, a quick fall was visible, which played out today.

3. It maybe difficult to believe looking today’s fall, but my analysis is
that the fall is over, and today was a follow up test of support levels,
to ensure all lower levels get tested in one shot. The same could have
been done at 2650, but the futures wanted to test lower like 2580. The
futures might fall further till 2550 briefly and bounce back from there.
Few months back, 2580 was a strong resistance and then it became a strong
support. I am confident 2580 will hold, and futures will bounce back up.

4. The S&P500 is falling more on lack of buyers than on selling pressure.
I believe the large funds managers are busy deciding at what level they
want to buy. This market is still a buy on dips market, the current fall
is setting the stage for next rally.

5. Similar falls of this type in the previous 5 years have taken 3-5 weeks
to build the base for the next upmove. It doesn’t look like the futures
will close above 2700 this week. Therefore, new highs of 2900+ may come
only in March or April, because it will take the futures 2-3 weeks to
build the base before moving up again. However, 2750 and 2800 are still
our targets for end Feb 2018.

6. There has been record high leverage in the market due to less
volatility and relatively good gains in year 2017. Some of those leveraged
positions will get cut in this fall, which will make the market stronger.

7. A couple of traders/investors asked me if this was a rewind of 2008
fall, which started in Jan 2018, and went on crushing prices lower till
year end. My analysis is that we are not at all in 2008 kind of scenario,
which came after 4-5 years of economic growth worldwide, and recession
data points were already visible on the dashboard. We don’t have such a
condition today, and global economic growth is just starting to picking
up, still weak in many places. We can expect new highs in S&P500 this
year, in the coming weeks and months. Thanks.

Emini Futures Trading Analysis- 17Oct2017

Hello Folks, the S&P500 Emini futures at 2556.75.
Today’s Range: 2552.25 – 2557.75
Please note the trade modification.
Trade#1 of Oct 2017 (updated target)
————————————————————–
Buy Emini Futures at 2552 for Target 2572 with Stop loss 2540.
————————————————————–
(Note: This trade was completed successfully on Oct 20, with 20 points gain)

The futures have moved well today. They showed strength despite intraday weakness. I saw the futures at 2553 in the morning, and was thinking that a close below 2550 will be negative, and a close above 2556 will be positive. The last several days of small narrow range days have set the stage for big move now. As stated yesterday, the probability of upmove is higher because the futures have been holding up above 2550. However, for any reason, if they go below 2550, then fresh selling can rapidly take the futures down to 2530-2535. Continue reading →