Emini Futures Trading Update – 04Jan2016

Hello Folks, Good morning. Wishing you a great New Year with health and success. This week starts with volatility coming from China, and their market was halted after -7% circuit breaker. What a way to start the new year!

Historically, Jan is a month of large moves, and it often takes the first few days to get the stage ready. So what we are seeing today may not be the actual trend of Jan, going by several past years.

We exited our long at 2049 Stop, because weakness was visible in the charts below that level. The S&P500 futures are at 1999 currently, down 37 points, or -1.8%. Such gap-down moves can’t be planned or traded. So its good that we had exited our long positions last week. Once the market stabilizes around 2000 level, then we could get an interesting trade set-up bwtween 2010 to 2090. As of now, there is no new trade. Thanks.
S&P500 Emini Futures Trading Update – 01Dec2015

During the last 5 trading days, volume in S&P500 index put options has lagged volume in call options by 35% as investors make bullish bets in their portfolios. This is among the lowest levels of put buying seen during the last 2 years, indicating extreme greed on the part of investors (doesn’t sound good to me because my contra indicator says, this is walking on thin ice till we cross 2135, the previous lifetime high). How long will this upmove last? We will see based on the selling resistance faced at 2120. Technically, this is a Buy zone. 2100 has just been crossed. If it can hold, then 2120, 2135, 2150 can come. Stop Loss on every long trade is 2085. If you want to a very safe trade, then you will have to wait for 2135 to be crossed on closing basis. The Stop loss on those trades would be 2120.

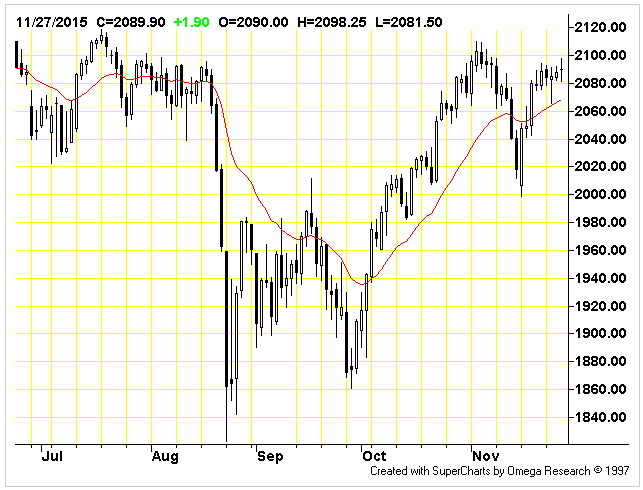
S&P500 Futures Chart Analysis – 27Nov2015

SPX Futures Chart Analysis – 27Nov2015

S&P500 Emini Futures have been trading in a tight range between 2080 to 2090 for last several days, with support at 2070. Therefore, as long as 2070 holds, the most likely targets are 2100 and 2120. The trend is up and we should stay long. If for any reason, the index starts falling, then short trades can be started from 2060 with stop loss at 2070. The probability of sudden fall is less because the index has been spending time and consolidating at the current level of 2085, waiting for the Thanksgiving holidays to get over.

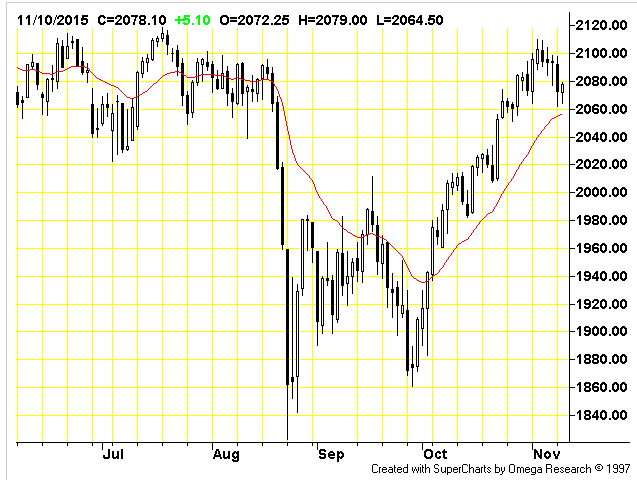
Emini Futures Chart Analysis – 10Nov2015

sp500-emini-futures-daily-chart-10nov2015

Date:Nov 10, 2015 Open=2072.25 High=2079.00 Low=2064.50 Close=2078.10

S&P500 Index is currently in uptrend, after forming a solid double-bottom at 1860-1870 level in early October 2015. The index has come back above 2050-2100 level from where it fell during Aug-Sep 2015. As long as S&P500 Index is above 2000 level, the uptrend remains intact, and we should remain long with futures. Below 2000, longs must be closed immediately, because deep downsides can start. So the major stop loss for all long trades is 2000 on S&P500 Index. Active traders can do long side trades on S&P500 E-mini Futures with 15-20 points as stop loss.