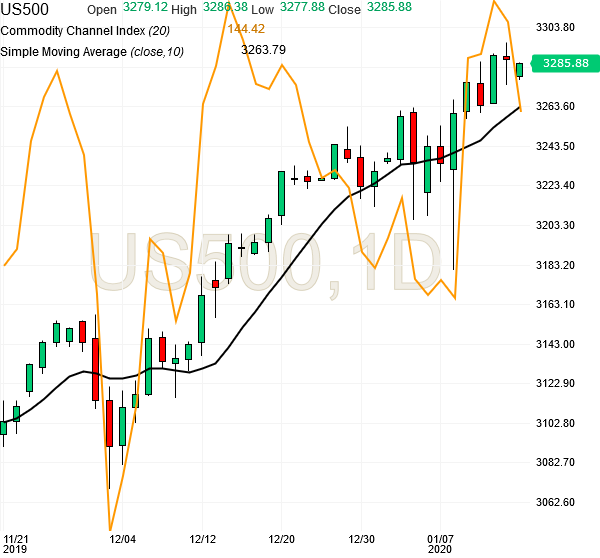
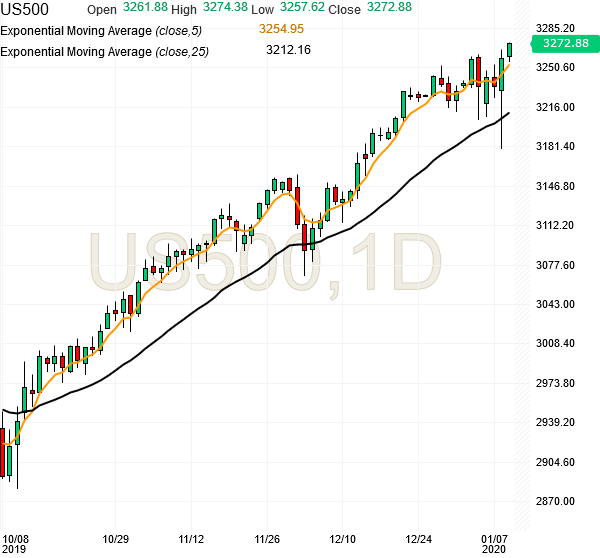
Emini Futures Trading Analysis- 16Jan2020

spx500-futures-daily-chart-analysis1-16jan2020

Hello Folks, the S&P500 futures are at 3320.50
Today’s Range: 3294.50 – 3323.00

The following Optional Trade, or Bonus Trade given yesterday got activated today morning at 3300, and got completed by eod today itself at 3320, giving 20 points gain.
“Buy at 3300 for Target 3320 with Stop loss 3280.”

It could have been a General Trade, but the set up was a bit less reliable that what we would like to have for a General Trade. Plus we would put to risk the 20 points we have already made earlier this month.

All along, we were sure of the futures hitting 3300 during Jan 2020, and the way they moved up today morning with a gap-up, it indicated clear buying strength, with increasing momentum. 3320 was visible as the target, but the path was not clear. We are glad it has given gains to several traders who used that input. 3325 may come tomorrow and the second Optional Trade can also complete, from 3305 to 3325.

Just fyi, it takes a lot more thought and analysis when we are trading at lifetime high levels like today, because we have no reference points from previous market action at that level, and we have to create them ourselves. We have to remain long, and we have to remain cautious. Thanks.

Emini Futures Trading Analysis- 15Jan2020

The S&P500 Futures are looking ready to cross 3300 level.
Above 3300, the immediate upside target will be 3320-3330.
Traders can use 3275 or 3280 as the Stop loss on long trades.

spx500-futures-daily-chart-analysis2-15jan2020

The support nearest level is at 3275, which was the level from which the futures bounced back on Tuesday, 14 Jan 2020 and the futures stayed above this level today, while trying to move higher, and made a new life time high of 3299.

SP500 Trend is clearly up, and traders should only do long trades.
However, the momentum is coming down, which may create resistance for upmove.

spx500-futures-daily-chart-analysis1-15jan2020

Emini Futures Trading Analysis- 14Jan2020

EOD Update, 14 Jan 2010
Please see the image below. It’s the 1 minute chart of SP500 futures, and it happened about 5-10 minutes after my previous mail, which was sent at 3294.25, and the futures tanked from 3294.75. Please see how 10 points were gone in just 2 minutes, and about 20 points were gone in 35-40 minutes. That’s why I was saying that the market conditions can become volatile rapidly, and we have to be very cautious at current levels, and preserve the gains we have already made in Jan 2020.
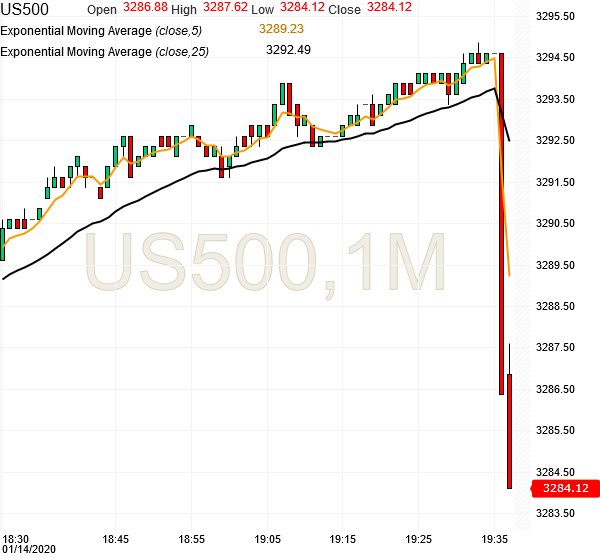
spx500-futures-1min-chart-analysis1-14jan2020

Could such a swift correction be anticipated and captured? Not really. Most traders and trading systems can’t catch such swift corrections, and we are better off watching it from the sidelines, and waiting for a better trading opportunity.

As mentioned earlier, this market can get volatile rapidly in current conditions, because of the heavy built up of speculative Call Options on the SP500.

Please see the daily chart below, with CCI indicator plotted on it. The daily chart is showing weakening momentum, which means further price rise will face resistance.
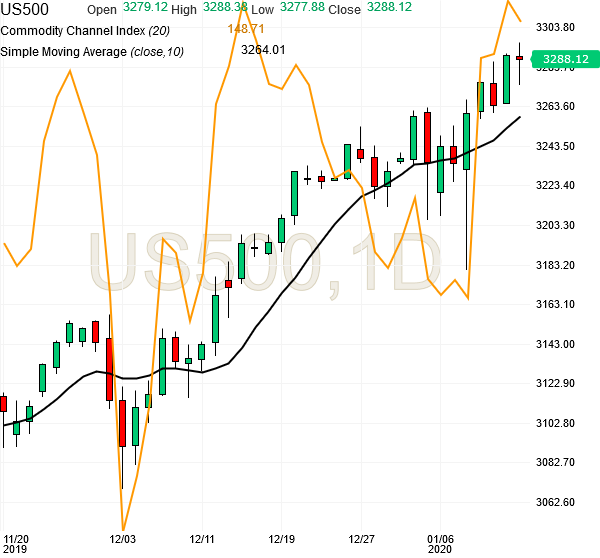
spx500-futures-daily-chart-analysis3-14jan2020

A positive outcome of today’s correction is that it has revealed that the current support level is at 3270-3275. So any long trade will need this as Stop loss. A clear long trade may emerge above 3290-3295. We must be very selective and cautious in any new trades.

Our Emini Futures Trading Strategy is to wait for clarity in the daily charts, and take long trades after corrections, or above 3300, which will be a fresh breakout on the upside and it can give 20-30 points. Thanks.

[Bonus Trade]
Buy at 3300 for Target 3320 with Stop loss 3280.

——————————————————————
Hello Folks, the S&P500 futures are at 3294.25
Today’s Range: 3275.50 – 3296.50

The futures are heading towards 3300, and 3320 is also possible, but the setup is not giving a clear trade. So are watching for a suitable setup for a long trade.

Please note that the current market is significantly overbought with the highest call option activity ever for SPY (the S&P500 ETF), so we have to be very careful here, because volatility can increase rapidly here, and even a 20-point stop loss will be gone within minutes. So we must wait and watch for a better quality setup. 3280 is a support as of now, in the near term, but it can’t hold any bigger selling.

All our Optional Trades have also completed at 3280, and there is no new trade of any type as of now. I will share some more notes later today. Thanks.

Please Note: The latest daily chart indicates that we can get a quick correction of 30-40 points below 3275, and momentum is also turning down, which will make it difficult for reliable upside move. We have to wait and see how the futures navigate the 3300 level.

spx500-futures-daily-chart-analysis2-14jan2020

Emini Futures Trading Analysis- 09Jan2020

Hello Folks, the S&P500 futures are at 3274.00
Today’s Range: 3257.50 – 3274.50

After the very big green day yesterday by S&P500 futures, which hit new highs, we were expecting some more follow up action today, and that is playing out as expected. The futures are heading towards our target 3280, which may come later today. So the upside room at current level is looking about 10 points more and we may get some resistance or selling pressure at 3280 level. 3300 is also possible by end of Friday, if 3280 can be crossed with strength.

S&P500 Futures Technical Analysis shows that the nearest support level is between 3240-3250, and next major support is at 3220. So any new long trade here will need a wide Stop loss. So we will wait and watch. We already have Optional Trades with targets of 3278 and 3280, but there is no new General Trade as of now.

The S&P500 trend is clearly up, as we have been saying for last several weeks. Our Emini Futures Trading Strategy is to buy on corrections. All corrections have been strong buying opportunities. The weekly chart of S&P500 futures is looking bullish, with the ability to cross 3300 without any difficulty in the coming week. Thanks.

[Bonus Trade]
Traders can buy on corrections near 3260 for Target 3290 with Stop loss 3230.

spx500-futures-hourly-chart-analysis-09jan2020

spx500-futures-daily-chart-analysis1-09jan2020

spx500-futures-daily-chart-analysis2-09jan2020

spx500-futures-weekly-chart-analysis-09jan2020

Emini Futures Trading Analysis- 08Jan2020

—————————————————————
Date and Time: Wed, January 8, 2020 4:13 pm, New York Time
—————————————————————
Hello Folks, the S&P500 futures are at 3258.50
Today’s Range: 3181.50 – 3267.50

The futures went up till 3267.50 today, and profit taking has come towards end of the day, and futures have come down to 3258. Today’s candlestick pattern on S&P500 futures is very rare. It is super bullish, but it is coming after a very good rally in last 8 weeks, so I have to study the entire market setup carefully tonight.

Overall, the setup is bullish above 3200, and 3220 is the main support level on the downside. The futures may try to test 3280 in the next 1-2 days. There is no new General Trade for now. Let me first complete my analysis of the current setup. I will mail you tomorrow morning with updates. Thanks.

—————————————————————
Date and Time: Wed, January 8, 2020 1:37 pm, New York Time
—————————————————————
Hello Folks, the S&P500 futures are at 3257.50
Today’s Range: 3181.50 – 3261.50

With S&P500 futures breaking below 3200, various negative scenarios were looking possible (that’s why the futures fell below 3200 in the first place!). So it was a lot of analysis effort last night (almost a night out) to decide the plan for today, but in the end it has paid off very well!! Continue reading →