Emini Futures Trading Analysis- 30Sep2019

Hello Folks, the S&P500 Futures are currently at 2983. This is a complex congestion zone between 2950 and 2980, where the futures are trying to form a base for upmove above 3000 but they have been failing to do that.

Our S&P500 Futures Trading Strategy is to stay long above 2980 for target 3080, with 2960 as the stop. Given the red candle of last week, there is weakness which needs decisive confrontation and that will be possible by two daily closings above 3000.

spx500-futures-daily-chart-analysis1-30sep2019spx500-futures-daily-chart-analysis2-30sep2019

spx500-futures-hourly-chart-analysis-30sep2019

spx500-futures-hourly-chart-analysis1-30sep2019

The 200 SMA line on the hourly chart is at 2990, which is the current main resistance level. So the futures will continue to face resistance between 2990-3000 level, like last week. Only above 3000, we will see better buying strength.

[Bonus Trade] Buy at 3000 for Target 3023 with Stop loss 2980.

Please Note: Below 2960, downsides will open up all the way down till 2900 and 2880 level. So 2960 should be the absolute stop loss for all long positions in S&P500 Futures.

Emini Futures Trading Analysis- 18Sep2019

spx500-futures-daily-chart-analysis-18sep2019

The S&P500 Emini futures are currently at 3002, and today and tomorrow will see higher volatility after the announcements by the US Fed on their latest interest rate policy and economic outlook. The market has already priced in 25 basis points (0.25 percent) rate cut.

There are two scenarios for S&P500 movement over next 24 hours (eod today and tomorrow). (a) If the rate cut does come at 25 bps, then there is a chance of profit taking after the US Fed announcement, which can take the futures back to their support level of 2960. (b) If the rate cut does not come, then 2960 will surely be tested and maybe also a lower level like 2900-2920. So in both scenarios, there maybe some price correction. Therefore, Traders should keep light positions to avoid whipsaw moves that can hit stop loss on both upside and downside.

If there is something in the Fed announcement, which indicates increasing strength in the US economy, then market can move up. A clear long trade is possible above 3033.

[Bonus Trade]
Buy at 3033 for Target 3063 with Stop loss 3013

At the current level, both long and short trades can create profits. Any sell trade should be attempted below 2960, which currently a strong support for S&P500 futures.


Emini Futures Trading Analysis- 10Sep2019

Hello Folks, the S&P500 Emini futures are at 2973 currently, and they have been consolidating after their breakout above 2940, which was a key resistance level. So we will surely see further upmove in coming days. Traders should stay long above 2940 for Target 3000 and 3015. We should see at least one testing of 3000 level in Sep 2019.

spx500-futures-daily-chart-analysis-10sep2019

Update, 11Sep2019: As expected and mentioned above, the S&P500 Emini futures have hit 3000 within this September month, on Sep 11, 2019, and within 30 hours of this post on Sep10, 2019. More upside is possible based on supportive macro data and US Fed announcements. There is a strong resistance at 3030, which needs to be crossed for next leg of upmove to 3070-3080. Thanks.

Emini Futures Trading Analysis- 05Aug2019

The S&P500 futures are at 2835. They have fallen by nearly 100 points today, which is one of the biggest single day fall since Dec 2018, when the S&P500 lost 20% in a month, with almost daily fall. As mentioned earlier, we should not have any long trade below 3000. The August 2019 month started in a similar way, after market topping patters at 3020-3025 level and then a very sharp correction has started last week, with the big fall coming today, because the S&P500 futures have broken their uptrend line today, which has been holding the uptrend since Dec 2018. This is a serious development because the uptrend support line is very important for the uptrend to continue, and as of today, it has failed. Please see the chart below.

spx500-futures-daily-chart-analysis-05aug2019

The futures have major support at 2790, which is the 200 day moving average, and then the next major support is at 2730, which has acted as a strong support twice in the last 12 months. The current fall will surely test 2790 before any real recovery. The 2800-2790 level should provide a support and create a bounce back to test higher levels, because the S&P500 futures have lost a lot of ground very rapidly, and so only two options are there for the current market condition: (a) we are already in a 2008-like meltdown, or (b) this correction is far-overdone. As of now (a) is not the case, so (b) is the case.

As I mentioned on 22nd July, the 3000-3020 level is a zone of caution, and we did not start any new trade after taking profit at 3020. We still don’t have any clear trade as of now. The sell off has been very sharp, so there will some kind of pull back at some point, which will take out every stop loss on the short trades at current level. And the set up is just not ready for any long trades. So we will just wait and watch for the next couple of days.

Traders should not initiate any long position in S&P500 futures as of now, because the downside targets have not been hit, and they need to be tested once, before any reliable upmove in the futures can come. So from the current level of 2830, we have 40-50 points downside still visible. With the broken uptrend line, the entire rally is at stake here, and the reliable long trades will come only above 2900. As of now, this month August 2019 looks washed out, and we have to see where the support levels come. Please note: the probability of 2900 coming in the next few days is very less, but if it comes in the next 1-2 weeks, then this market is poised for bigger upside.

Here are two Bonus Trades that express our market view in clear terms.
[Bonus Trade#1] Sell SP500 futures at 2840 for Target 2790, with Stop Loss 2880.
[Bonus Trade#2] Buy SP500 futures at 2790 for Target 2890, with Stop Loss 2730.

Update Friday, 9th August 2019:
Both the above Bonus Trades hit their targets from their given entry levels, giving 50 points gain on the downside, and 100 points gain on the upside. The most important point is that the futures managed to come back above 2900 within the same week, which confirmed strong support at 2790 (200 day moving avg) and amazing strength for further upside to new highs. The futures closed Friday at 2922. Keeping 2890 as Stop loss, we should continue trading on long side for target 3000. Thanks.

Emini Futures Trading Analysis- 22July2019

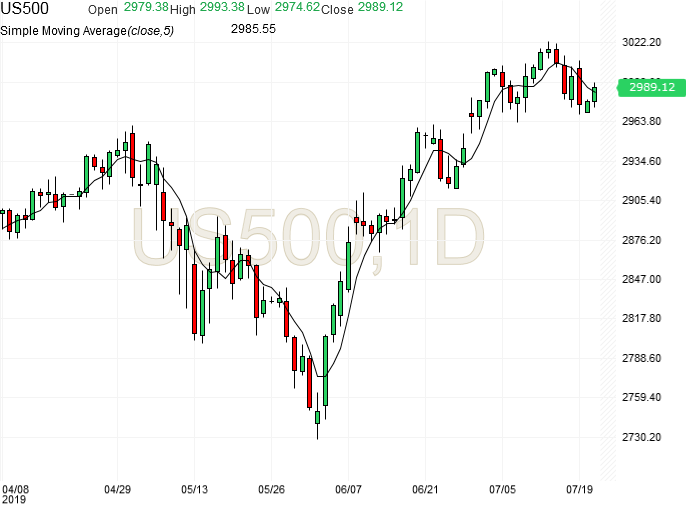
Hello Folks, the S&P500 futures are currently at 2989.00
Today’s Range: 2974.75 – 2993.25

The futures closed below their 20 day SMA on Friday, 19th July, which created a short term weakness, but the futures have shown some strength today by closing back above their 20 day SMA. This kind of turnaround on the 20 day SMA does not unusually happen so fast. So we want to be very alert at current levels.

The futures have been giving divergent signals since last few days, and any new long trade can be considered above 3000 only. At the current level of 2989, there is a 50-50 chance of retest of 2950 level.

So, this is a zone of caution, as the market can move in either way by 40-50 points rapidly. If the futures start going down, then 2930 is the downside target, which also aligns with a head and shoulder pattern that would be developing below 2770.

The S&P500 trend is still clearly up, so any weakness here is more likely to be a short term weakness, which will reverse by September 2019.

Trade updates:
Trade#4 of July 2019 (target hit on 15th July)
——————————————————————–
Buy at 2970, Target 3020, Stop loss 2980 (trailing stop loss)
——————————————————————–

As of now, there are no new trades. If we get a correction here, then we will have to be cautious for next 3-4 weeks. We will mail you with more notes tomorrow. Thanks.

spx500-futures-daily-chart-analysis-22july2019

spx500-futures-daily-chart-analysis1-22july2019

spx500-futures-5hr-chart-analysis-22july2019

spx500-futures-hourly-chart-analysis-22july2019