Emini Futures Trading Analysis- 19Nov2019

The S&P500 Emini futures are currently at 3131 in pre-market trading, up 10 points from yesterday’s closing of 3121.

Yesterday (Monday) was looking like a bearish setup during the day but the S&P500 Emini futures pulled up into green by the end of the day, and created a doji like candle, which indicated that the selling pressure was met with equal buying demand. Today’s pre-market upmove to 3131 indicates that we have some more bullish upmove potential, till 3150. However, if the futures start trading below 3110, which is below the low of yesterday, then selling pressure can increase rapidly and 3080 can be retested by end of Friday. So the market range is from 3080 to 3150.

[Bonus Trade] Buy at 3122 for Target 3145 with Stop loss 3110.
Yesterday’s low was 3111.25, so 3110 is a very suitable stop loss for this trade.

The weekly chart S&P500 futures is showing stalling of momentum, which indicates that we are probably near the top end of this rally now, and we may see a red weekly candle within the next 1-2 weeks, if not this week itself.

spx500-futures-weekly-chart-analysis-19nov2019

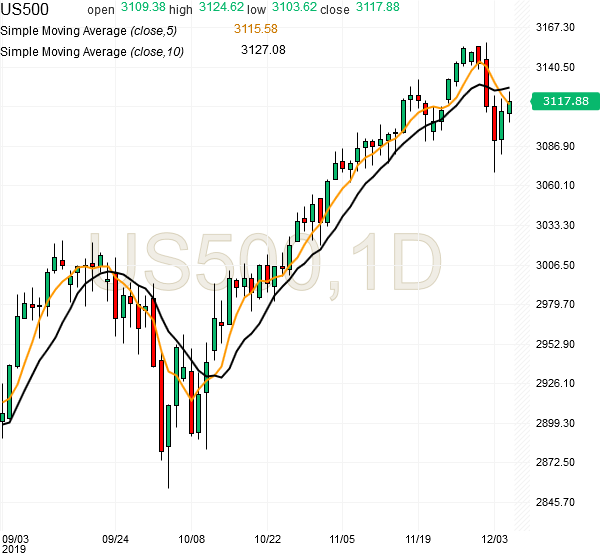
The daily chart of S&P500 futuresis showing reducing momentum in the latest part of this rally, compared to previous rally, so that is an indication of stalling in the price upmove in the near future, maybe in 3-5 days.

spx500-futures-daily-chart-analysis-19nov2019

The hourly chart of S&P500 futures is showing strong momentum, which is supporting the current upmove from 3100 to 3131. But this hourly momentum can rapidly swing to downside once any strong selling comes, so we have to give more important to daily and weekly charts for understanding the market trend. The hourly chart will help us take a few tactical trades. For example, a long trade from 3100 to 3130 has been completed.

spx500-futures-hourly-chart-analysis-19nov2019

Emini Futures Trading Analysis- 18Nov2019

The S&P500 Emini futures are currently at 3121, at the time of closing for the day.
The futures fell sharply intraday to 3111 but managed to bounced back by the end of the day to 3121, thereby showing that there is still enough buying strength in this market, and even a bearish looking setup was rapidly avoided and used for adding long positions by the buyers.

We have a doji like candle today, and therefore, tomorrow’s price action will be very important, and it can create a big 25-30 point move either on the upside or downside. Today’s high was 3127.50, so the futures will become bullish above 3128 for at least 20 points more gain, so 3150 will be immediate target above 3128. On the other hand, the futures will become bearish below today’s low of 3111, and 3080 will become the immediate downside target. So we now have a market which can move rapidly between 3080 and 3150.

The S&P500 index is in strong uptrend above 3000 level. The S&P500 futures have come up above 3100 after testing the 3070-3080 support level for a many days, so that support level is strongly in place.

Our Emini Futures Trading Strategy is to stay long, and keep buying on corrections, as long as the futures are above 3080.

[Bonus Trade] Buy at 3121 for Target 3145 with Stop loss 3110.
Today’s low is 3111, so 3110 is an ideal stop loss for this trade.

Emini Futures Trading Analysis- 13Nov2019

The S&P500 Futures are currently at 3094.
They have been testing the support at 3080 level for last 5 days.
The futures went down today again till 3075 and bounced back to 3090.

The futures have defended 3070 level 3 times in last one week.
So the support is between 3070-3080 level.
And 3070 should be the stop loss on all long trades, even on intraday basis.

Our Emini Futures Trading Strategy is to stay long above 3070.
The target for the next upmove is 3125. We will increase long positions above 3100.

The following daily chart of the S&P500 futures shows how the recent upmove has been carrying forward smoothly above the 10 day SMA (simple moving avg). Therefore, a closing below the 10 day SMA, which is currently at 3077 is the stop loss for all long trades.

spx500-futures-daily-chart-analysis-13nov2019

Once 10 day SMA breaks, the futures can move down rapidly to test 3000-3010 level.
Below 3070, the next major support is 3000, which becomes the target for the downside.

Here are two tactical trades that can be done by active and alert traders.
[Bonus Trade#1] Buy at 3090 for Target 3120 with Stop loss 3075.
[Bonus Trade#2] Sell at 3070 for Target 3040 with Stop loss 3085.

Emini Futures Trading Analysis- 11Oct2019

Hello Folks, the S&P500 futures are currently at 2978.00
Today’s Range: 2941.25 – 2993.00

The futures have made a big move today after creating a good base in the last two days. Today’s upmove is looking reliable coming on the back of a very good setup made in the last 2 days. But we have a weekend coming up, which has a tendency to create gap-ups and gap-downs by Monday morning, so I am analyzing our next long trade here.

spx500-futures-daily-chart-analysis-11oct2019

Please Note: There is a major resistance currently at 2976.
We need daily closing above 2880 for clean upmove to 3020-3030 level.
That will be a reliable long trade.

spx500-futures-5hr-chart-analysis-11oct2019

Our S&P500 Trading Strategy has been to stay long and buy all corrections above 2850 level, and that has given good gains in the last 3 months.

[Bonus Trade]
Buy at 3000, for Target 3023, with Stop loss 2980″.

Market Notes:

  • The futures were volatile in the early part of this week and on 8th Oct 2019, the futures suddenly dipped below 2890 from 2920-2930 levels in pre- market around midnight UK time, thereby taking out the stops of most traders in the market, and then bounced back to 2920 levels before market open.
  • We were in the market at night on 8th Oct, and saw this live, and quickly bought futures at 2885-2890 levels with 2850 Stop loss, and were able to sell them after 5 hours at 2920-2925 levels, all of this in pre-market trading! But those are high speed, dynamic trades with 50-50 chance of success, which can’t be used as General Trades for all traders based in different locations and time zones.
  • Our larger traders who do Optional Trades with 1-2 contracts (and General Trades with with full volume of Emini contracts), could use our default trade at 2900 once again this week. Our default trade since Aug 2019 has been: “Buy at 2900 for target 2930 with Stop 2880”.

Next Steps: Today is looking a clear case of S&P500 Breakout Trading. There is no immediate trade as of now, but please stay alert because a new trade may come if 2880 is crossed successfully today on closing basis. Thanks!

End of Day Update: The futures went up till 2993 and were trading above 2980 most of the day, but could not close above the major resistance of 2976! This creates fresh downside possibility of retest of 2950 next week, but the upside target of 3000+ can also come in the next 1-2 weeks. So we should aim to buy the corrections with a stop loss of 2930. Its good that we did not buy at 2985-2990 levels during the day otherwise our stop loss would have got hit by end of day. Now we just have to select a fresh entry point for taking a long position next week.

Following is the weekly chart of the S&P500 futures. The last two weeks have shown strong defense of lower levels below 2900 and it has set up the stage for testing 3000-3050 levels. Thanks.

spx500-futures-weekly-chart-analysis-11oct2019

Emini Futures Trading Analysis- 30Sep2019

Hello Folks, the S&P500 Futures are currently at 2983. This is a complex congestion zone between 2950 and 2980, where the futures are trying to form a base for upmove above 3000 but they have been failing to do that.

Our S&P500 Futures Trading Strategy is to stay long above 2980 for target 3080, with 2960 as the stop. Given the red candle of last week, there is weakness which needs decisive confrontation and that will be possible by two daily closings above 3000.

spx500-futures-daily-chart-analysis1-30sep2019spx500-futures-daily-chart-analysis2-30sep2019

spx500-futures-hourly-chart-analysis-30sep2019

spx500-futures-hourly-chart-analysis1-30sep2019

The 200 SMA line on the hourly chart is at 2990, which is the current main resistance level. So the futures will continue to face resistance between 2990-3000 level, like last week. Only above 3000, we will see better buying strength.

[Bonus Trade] Buy at 3000 for Target 3023 with Stop loss 2980.

Please Note: Below 2960, downsides will open up all the way down till 2900 and 2880 level. So 2960 should be the absolute stop loss for all long positions in S&P500 Futures.