S&P500 Emini (ES) Futures: Navigating Volatility in Q1 2026

Technical Analysis: S&P 500 E-mini (ES) Futures Q1 2026 Outlook

By Jupiter Futures // Date: March 5, 2026

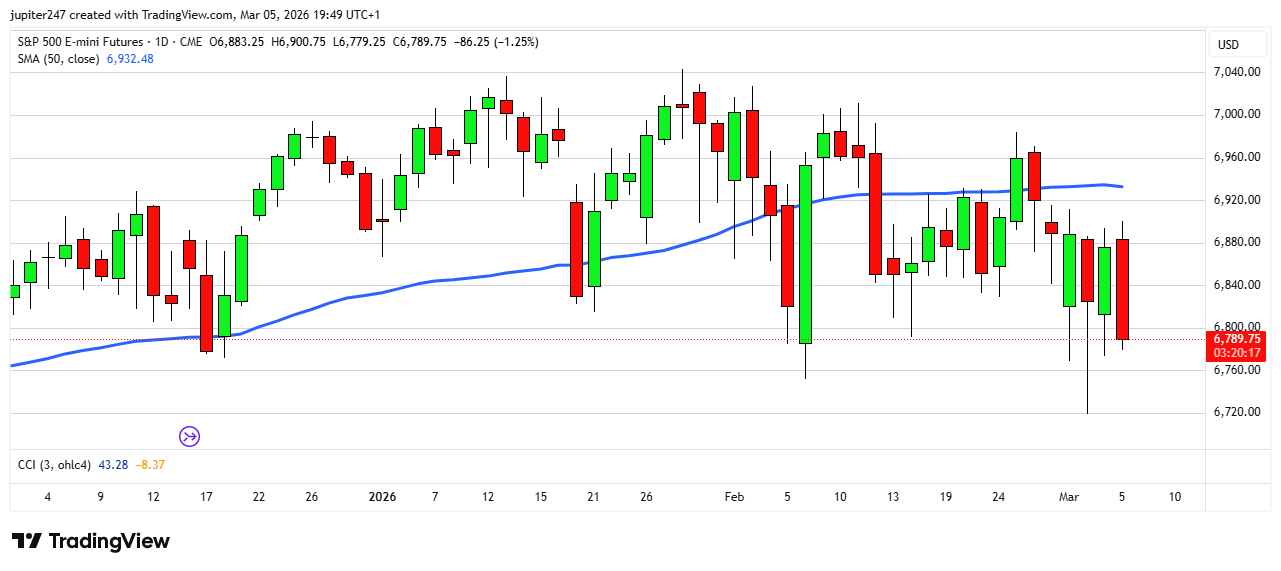
Market State: Tactical Consolidation, Current Price: 6,785 (ESH26)

After a blistering start to the year, the ES is currently undergoing a healthy “valuation reset.” The rejection at the 7,043 lifetime high in late January has shifted the short-term trend from parabolic to a defined consolidation range.

1. Key Resistance Zones: The Road to 7,000

With the index currently trading under the 6,800 handle, bulls need to reclaim specific technical territory to regain momentum:

  • Major Resistance 1 (6,850 – 6,870): This is the current “supply zone.” We’ve seen multiple rejections here in the last 48 hours. A daily close above 6,870 is required to flip the narrative back to bullish.

  • The 7,000 Psychological Barrier: Beyond the recent high of 7,043, 7,000 remains the ultimate “sell-wall.” In the options market, we are seeing heavy open interest in March 7,000 Calls, suggesting institutions are using this level to hedge or take profits.

2. Critical Support Levels: The “Line in the Sand”

The 6,780 level puts us right in the heart of a high-volume node. If the current dip deepens, watch these levels:

  • Pivot Support (6,790 – 6,780): We are currently testing this zone. This was a “line in the sand” earlier this week. Holding here keeps the “bull flag” structure on the daily chart intact.

  • Demand Zone (6,718 – 6,730): This represents the March three-month low. If this level fails, the technical structure breaks down, potentially opening the door for a deeper correction toward the 6,640 liquidity pocket.

3. Macro-Technical Indicators

  • Relative Strength Index (RSI): Currently sitting at 43.5, indicating the market is neutral-to-oversold on a 14-day basis. We aren’t in “panic” territory yet, but the momentum has clearly cooled.

  • Volume Profile: We are seeing “thin air” above 6,900. Price discovery in the 6,950–7,000 range has been low-volume, suggesting that moves back into that area may be volatile and prone to “fake-outs.”


Q1 Trading Game Plan

The current 6,785 print is a tactical decision point. If the ES can defend the 6,780 zone through the end of the week, the setup favors a move back toward the 6,900 target. However, with Brent Crude stubbornly holding above $84, any further energy-driven inflation fears could act as a gravity well, pulling the ES down to test that 6,718 support.

Next Step: Contact Us for Profitable SP500 Futures Trading Signals.


Disclaimer: This market review is for informational purposes only. Futures trading, especially high-leverage products, involves substantial risk of loss and is not suitable for all investors. Past performance is not indicative of future results.

Emini SP500 Futures Trading Analysis- 15May2025

Hello Folks, here’s the latest technical analysis of Emini S&P 500 Futures (ES) based on hourly, daily, and weekly charts:

The current market price of S&P 500 E-mini Futures is 5,930.
The futures have gained more than 1000 points from their April lows of 4,850.
Please Note: The symbol for Emini S&P 500 Futures (ES) on Tradingview is ES1!

Hourly Chart Analysis:
– The ES chart shows a strong support at 5680, indicating strong buyer interest.
– A potential long trade setup is identified with favorable risk-reward dynamics.
– Traders are advised to watch for intraday levels and potential trade setups.

Daily Chart Analysis:
– S&P500 futures are trading with a bullish bias, influenced by US-China trade talks.
– Current upside target is 6000, which is about 70 points above current price, with a possible continuation of the upward movement.
– Above 6000, there can be a sharp upside rally, with price target is 6400.

Bonus Trade (yet to be triggered):
Stay long above 6000 for target 6400.

Weekly Chart Analysis:
– The main trend is upside, with clear technical patterns and signals.
– Fibonacci analysis indicates potential retracement or extension levels, while trendlines show a strong upside trend.

Technical Indicators:
– CCI is clearly in the buy zone, favoring a long position. The technical rating is “buy” based on various indicators, but market conditions can change quickly around 6000 level on profit taking. Traders must expect volatility near 6000 level.
– Moving averages and MACD-Histogram can be used to identify trends and momentum. Traders should also watch for support and resistance levels, such as 5710, which is acting as short-term resistance.

Emini Futures Trading Analysis- 03Sep2020

SP500-futures-daily-chart-analysis-03Sep2020

The S&P500 futures have suffered a large one-day correction today, with day high at 3584, and day low at 3424. Today’s fall has decisively broken the recent parabolic uptrend (curve line marked in the above chart).

The uptrend support trenline is coming at 3350 level, which is still about 90 points below current market rate. Now, the futures will surely need to test 3350 before getting any reliable or durable recovery. Below 3350, fresh breakdown will happen, and the next proper support is coming at 3200 level, which would be further 150 points below, or 240 points below current level.

The S&P500 futures will try to bounce back over next 1-2 days towards 3460-3480 and that rise can be used for selling, by exiting longs or initialing short positions. The futures will find it difficult to cross 3500, so that’s should be the stop loss for any short trades.

[Bonus Trade]
Sell at 3460 for Target 3350 with Stop loss 3500.

Update: The above trade started and completed within one day on Sep 4th!

Emini Futures Trading Analysis- 10Aug2020

Hello Folks, the S&P500 futures are currently at 3350.
The futures are in uptrend currently and 3400 (new high) is the target.
Major trend line resistance coming at around 3500, which is much higher.
However, 3400 will also create selling pressure.
Please see the attached the daily chart analysis of S&P500 futures.

sp500-futures-daily-chart-analysis-09aug2020

The S&P500 futures made an upmove/breakout above 3280 till 3330 exactly as we expected, giving 50 points gain.

Previous Optional Trade hit target at 3330 and gave 50 points gain.
“Buy at 3280 for Target 3330 with Stop loss 3250”

Here is a new Optional Trade.
“Buy at 3350 for Target 3380 with Stop loss 3320”
This trade can also be done with Emini Micros or CFDs. Thanks.

Traders should take profits regularly, and stay long above 3300 for Target 3400 and 3500.

Absolute stop loss for all long trades is 3200, which is 150 points below.In case of major correction, the futures may fall back to their 200 DMA near 3030. We can buy on corrections, and stay long above 3200 for target 3400.

The immediate long trade is from 3330 to 3400. There is a chance that the futures may correct back to 3300 on profit taking and they make a fresh attempt to 3400. The volatility is still high to do a General Trade with full capital. In current conditions, we can only do trades with a small part of our capital and aim for 30-50 points on those trades. Thanks.

Emini Futures Trading Analysis- 12June2020

sp500-futures-30min-chart-analysis-12jun2020
Hello Folks, the S&P500 futures are 3048.50
Today’s Range: 3003.50 – 3087.25

The futures had a 230+ point cut in the last 48 hours, falling from 3230 to 2996. In hindsight, our target of 3230 on the General Trade turned out to be the market top, and we were fortunate with that, and even on the next Optional Trade, which also completed successfully.

The following Optional Trade (for Traders with 10+ contracts) was completed successfully with 24 points gain before weakness started creeping in on Wednesday, 10th June.
“Buy 1-2 contracts at 3196 for Target 3220 with Stop loss 3180”

Now, the volatility is high, and we don’t have a General Trade. But we are seeing upside of 3175-3180 currently, though it will be tricky to capture.

[Bonus Trade] Suitable for larger traders with a small part of capital.
“Buy at 3050 for Target 3175 with Stop loss 3000”

Market Notes and Analysis:
As indicated in previous mails, the S&P500 futures have a major resistance at 3250and we need a monthly closing above 3250 for this resistance to be taken out. The S&P500 futures tried to do that in Jan-Feb 2020 but could not succeed, and faced a big penalty for failure to cross that key hurdle.

In addition, the overall Total Equity Put/Call ratio was at an extreme low by Wednesday, 10th June, which indicated significantly one-sided bullish bets piling up in the system, which would not make it easy to cross the 3250 resistance. So, the meltdown of yesterday was very much a technical correction, and its also aimed to test the support at 3000 level.

Overall, traders have to be cautious at current levels and wait for confirmation that 3000 level (200 DMA is 3020) is getting defended, because the real big selling pressure will come below 3000. Thanks.