Emini SP500 Futures Weekly Analysis- 05Mar2026

Looking at the S&P 500 E-mini (ES) on the weekly timeframe as of March 5, 2026, we are seeing the first significant cracks in the “four-peat” bull market thesis. After closing 2025 at approximately 6,845, the first nine weeks of 2026 have been a battle to maintain that momentum.

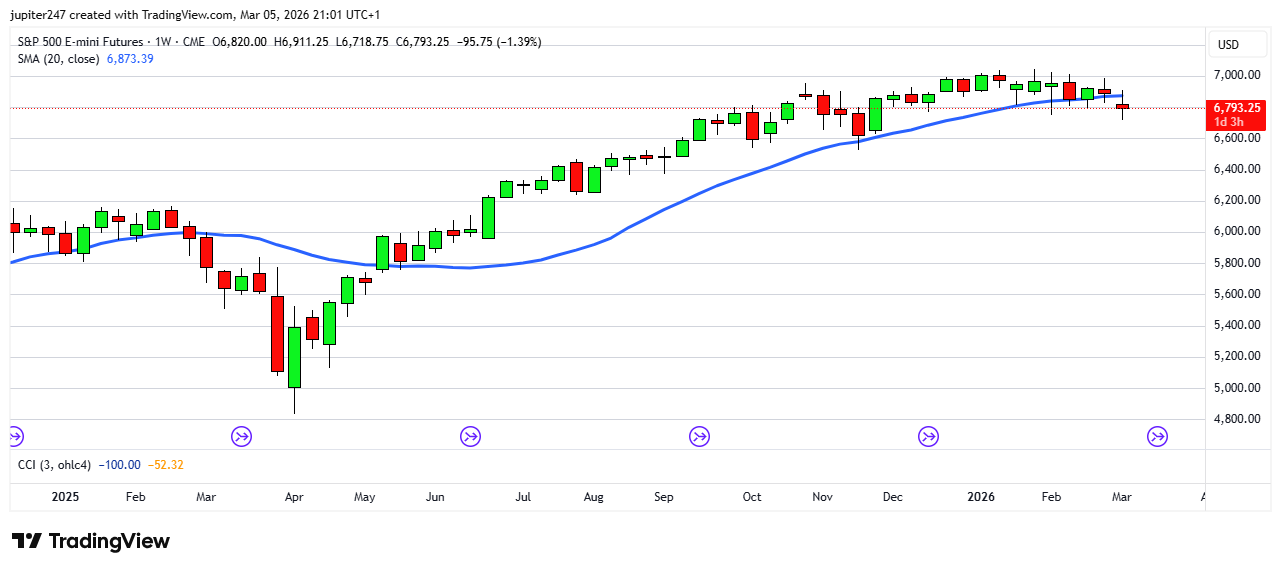
At the current price of 6,795, here is the structural breakdown:

Most Important Point: We’re below 20 Week SMA — that’s an alarm. ES futures are safe only above 6880. Be careful now.

1. Weekly Trend Structure: The “Tired” Bull

The primary trend remains bullish on the macro scale (the 4-year cycle from 2023), but the weekly chart is showing a Lower High for the first time in months.

  • The 7,043 Peak: This late-January print now stands as a major “blow-off top” candidate on the weekly scale. We saw high volume on that rejection, suggesting institutional distribution.

  • Weekly Candle Action: We are currently tracking a series of “Long-Legged Dojis” and “Hanging Man” patterns over the last three weeks. This indicates extreme indecision at these elevated valuations, especially with the $84+ Crude Oil headwind.

2. Key Weekly Moving Averages

Since we’ve spent most of 2025 in a vertical climb, the moving averages are struggling to keep up, creating a significant “mean reversion” risk:

  • 10-Week EMA (~6,810): We are currently trading below the 10-week Exponential Moving Average. This is a critical short-term red flag; historically, when the ES loses the 10-week EMA, it often leads to a multi-month consolidation or a deeper 5-7% correction.

  • 50-Week SMA (~6,420): This is the “Grand Magnet.” If the current geopolitical-driven inflation fears persist, a pullback to the 50-week SMA (roughly 5% lower from here) would be the most logical spot for long-term trend followers to re-engage.

3. Weekly Indicators

  • Weekly RSI: It has finally retreated from the “Extreme Overbought” zone (>80) seen in December and is now hovering at 58. This is a “cooling off” signal. However, there is a bearish divergence—while price made a higher high in January (relative to Nov ’25), the RSI made a lower high, suggesting the buying pressure is exhausting.

  • MACD: We are on the verge of a Weekly Bearish Cross. If the histogram flips negative by the end of this Friday, it would be the first sell signal on this timeframe since the brief dip in Q3 2025.


Weekly Summary & Targets

The weekly chart suggests we are entering a Stage 3 Distribution Phase. The market is no longer in a “buy-everything” mode; it’s picking its spots.

  • Weekly Bull Case: Reclaim and close the week above 6,850 to negate the bearish candle sequence and re-open the path to 7,000.

  • Weekly Bear Case: A weekly close below 6,730 (the February floor) would likely trigger a fast liquidation down to the 6,550 level, which aligns with the .382 Fibonacci retracement of the 2025 rally.

Next Step: Contact Us for Profitable SP500 Futures Trading Signals.


Disclaimer: This market review is for informational purposes only. Futures trading, especially high-leverage products, involves substantial risk of loss and is not suitable for all investors. Past performance is not indicative of future results.

Emini Futures Trading Analysis- 18June2021

sp500-futures-5hr-chart-analysis-18june2021

Hello Folks,
The S&P500 futures are currently at 4171.
A large correction is taking place, wiping out yesterday’s market recovery. There is no General Trade currently till conditions stabilize and the futures move above 4200..

Support levels are visible at 4150 and 4170.
Resistance levels are visible at 4200 and 4230.

[Bonus Trade]
“Buy at 4170 for Target 4190 with Stop 4160.”
Please Note: This is suitable for large traders who are regularly trading with 10+ contracts, using 2-3 contracts in this Optional Trade. This trade aims to use the likely recovery in prices after today’s selling. The futures are at one of the support levels, so we can buy a small position. Thanks.

sp500-futures-daily-chart-analysis-18june2021

Emini Futures Trading Analysis- 03Sep2020

SP500-futures-daily-chart-analysis-03Sep2020

The S&P500 futures have suffered a large one-day correction today, with day high at 3584, and day low at 3424. Today’s fall has decisively broken the recent parabolic uptrend (curve line marked in the above chart).

The uptrend support trenline is coming at 3350 level, which is still about 90 points below current market rate. Now, the futures will surely need to test 3350 before getting any reliable or durable recovery. Below 3350, fresh breakdown will happen, and the next proper support is coming at 3200 level, which would be further 150 points below, or 240 points below current level.

The S&P500 futures will try to bounce back over next 1-2 days towards 3460-3480 and that rise can be used for selling, by exiting longs or initialing short positions. The futures will find it difficult to cross 3500, so that’s should be the stop loss for any short trades.

[Bonus Trade]
Sell at 3460 for Target 3350 with Stop loss 3500.

Update: The above trade started and completed within one day on Sep 4th!

Emini Futures Trading Analysis- 27May2020

The S&P500 futures are currently at 2976.00 and down by 60 points from day high.

Today is the second day of the S&P500 futures trading around the 3000 level, which is also their 200 day moving average. Our tactical trading target of 3030 was hit today morning, and the futures went up till about 3035 and then faced a sharp 70 points correction from there to 2965.

The parabolic upmove of today morning got broken and the entire upmove of today got liquidated. Please see the charts below. The warning sign for a reversal of the entire upmove can once the parabola was broken below 3030, and the futures fell down till 2965!!

spx500-futures-1min-chart-analysis1-27may2020

spx500-futures-1min-chart-analysis2-27may2020

spx500-futures-1min-chart-analysis3-27may2020

All this part of the 200 DMA testing at 3000 level. Nobody should expect a smooth run away rally from this very key level. This 3000 level is a major target, and also major resistance, when we are approaching it from below.

The S&P500 (or SPY) call options data indicated very high call options build up, which is usually not helpful for fresh upmove at key levels. So traders must be cautious here. Please keep 2950 as stop loss for any long position.

spx500-futures-30min-chart-analysis1-27may2020

[Bonus Trade] Here’s a rapid tactical trade, for a bounce back.
Buy SP500 futures at 2975 for Target 2995 with Stop loss 2960.