Market Trend: The futures tested the support level of 2340-2350 this past week, and bounced back from there. If the futures move up above 2383, then higher levels can come in the next 10 days. The futures will become bearish below 2380. So it is a very thin line between bullishness and bearishness in the coming week. A retest of 2360 level is likely, and another retest of 2350 level is also possible, though it is less likely as of now. The upside targets are visible in the range of 2420-2430. For the immediate term, the key level to defend is 2380. Strong supports are visible at 2250 on the weekly charts, so if you see 2250 for any reason, you can create fresh long positions at 2250 for for a retest of 2280-2290, before any major downside opens.
[Bonus Trade] Traders can go long at 2380 for Target 2420 with Stop loss 2350.
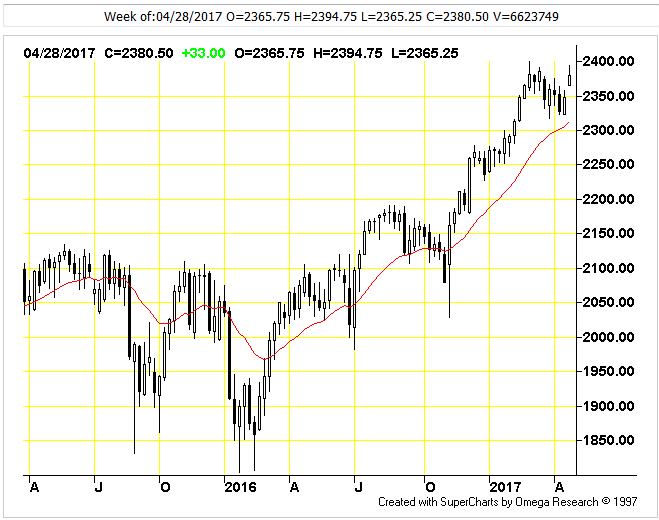
Technical Analysis of S&P500 Emini Futures Weekly Chart
Moving Average Indicator: Price is above the moving average so the trend is up. The market is bullish. However, recently the market has been extremely bullish, however currently the market has lost a some of its bullishness Its possible that we may see a market pullback here. In such a case, the pullback will be a good buying opportunity.
Commodity Channel Index (CCI) Indicator: CCI (70.48) is in neutral territory. A signal is generated only when the CCI crosses above or below the neutral center region. CCI often misses the early part of a new move because of the large amount of time spent out of the market in the neutral region. Initiating signals when CCI crosses zero, rather than waiting for CCI to cross out of the neutral region can often help overcome this. Given this interpretation, CCI (70.48) is currently long. The current long position position will be reversed when the CCI crosses below zero. The market just signaled a bearish key reversal off a 9 bar new high, suggesting closing any long positions here. Continue reading →