Emini Futures Trading Update- 06July2016

Following is our email sent to subscribers on July 6, 2016.

Hello Folks, the futures are currently at 2086. They have recovered nicely from day low of 2066. However, selling pressure is visible on daily charts, and today’s lower level buying may not hold if fresh round of selling comes. At the same time, the V-shape recovery from lower levels after Brexit is impressive. It is possible that 2100 on futures will get tested again.

——————————————–
Please note our Emini Futures Trading Strategy for this July month: The 2053 number in futures is still intact as the dividing line for positional long and short trades. Below 2053, we start a short trade with 2063 as stop. Above 2053, we start a long trade with 2043 as stop.
——————————————–

* Traders with 1-2 contracts: There is no trade as of now for you.
* Traders with 5-10 contracts: You may buy 1-2 contracts at 2086 for target 2096, with Stop 2076. This tactical trade can play out by Friday. Thanks.

Emini Futures Trading Update – 30June2016

Hello Folks, the futures are currently at 2088.
Our Trade#6 has its target of 2083 today afternoon, and therefore, this trade is closed, along with month-end today. We will start new set of trades from tomorrow, 1st July.

The v-shape recovery after Brexit reminds me of the v-shape recovery after the first Grexit news flow in 2011 and then the S&P500 went up further after emphatic bounce back. If S&P500 index goes above 2100 again, then we will see new highs in the coming weeks and 2250 will be our target.

Just like we have a standing trade, to go long above 2053, we will have a new standing trade above 2135, which will ensure that we are benefiting from the upmove. I will give the exact details of this trade once S&P500 index is at 2120 and nearing the previous highs. Thanks.

[Positional Trade Update]: Traders with multiple contracts who went long above 2053 (our automatic long trade), can now close their long positions today/tomorrow around 2083-2093 (current levels), and take out the 30-40 points profits. We will plan new positional trade for July from tomorrow. Thanks.

Wishing good luck and fortune to every sincere and disciplined Emini Futures trader out there. Thanks for visiting our website.

Emini Futures Trading Update – 12Apr2016

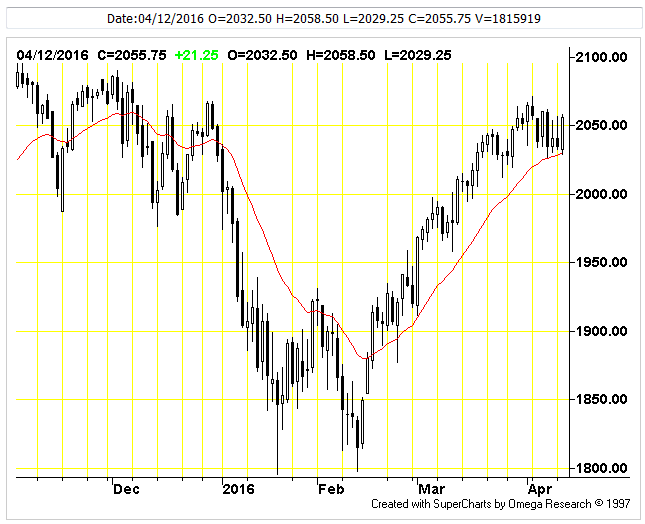
spx-daily-chart-12apr2016

Technical Analysis of S&P500 Index Futures

RSI Indicator: RSI is in neutral territory. (RSI is at 60.57). This indicator issues buy signals when the RSI line dips below the bottom line into the oversold zone; a sell signal is generated when the RSI rises above the top line into the overbought zone. RSI is somewhat overbought (RSI is at 60.57). However, this by itself isn’t a strong enough indication to signal a trade. Look for additional evidence before getting bearish.

CCI Indicator: CCI (57.58) is in neutral territory. A signal is generated only when the CCI crosses above or below the neutral center region. CCI often misses the early part of a new move because of the large amount of time spent out of the market in the neutral region. Initiating signals when CCI crosses zero, rather than waiting for CCI to cross out of the neutral region can often help overcome this. Given this interpretation, CCI (57.58) is currently long. The current long position position will be reversed when the CCI crosses below zero. Continue reading

Emini Futures Trading Update – 18Mar2016

sp500-emini-futures-weekly-chart-18mar2016

S&P500 Technical Analysis – for Week of 18 March 2016

The above weekly chart of S&P500 Emini Futures indicates a triple bottom at 1850, and hence a strong bounce back, which has the strength to go all the way till 2100. We have got 5 green weeks back to back, which is one of the most powerful rallies in recent years. Above 2100, the market opinion will be very divided, and there will be enough people willing to short, and any further advances above 2100 will need good support from strong corporate earnings and global macroeconomics data.

Moving Average Indicator: The market is very BULLISH. Everything in this indicator is pointing to higher prices: the fast average is above the slow average; the fast average is on an upward slope from the previous bar; the slow average is on an upward slope from the previous bar; and price is above the fast average and the slow average. Market trend is UP as long as the S&P500 index is above 2000 level.

Momentum Indicator: Momentum (138) is way above zero, indicating an overbought market. The long term trend, based on a 45 bar moving average, is DOWN. The short term trend, based on a 9 bar moving average, is UP. Momentum is indicating an overbought market. However the market may continue to become more overbought. Look for further evidence of weakness before getting bearish here. Momentum is likely to increase above 2050 on S&P500 index. So avoid short positions above 2050. Continue reading

S&P500 Emini Futures Trading Update – 01Dec2015

During the last 5 trading days, volume in S&P500 index put options has lagged volume in call options by 35% as investors make bullish bets in their portfolios. This is among the lowest levels of put buying seen during the last 2 years, indicating extreme greed on the part of investors (doesn’t sound good to me because my contra indicator says, this is walking on thin ice till we cross 2135, the previous lifetime high). How long will this upmove last? We will see based on the selling resistance faced at 2120. Technically, this is a Buy zone. 2100 has just been crossed. If it can hold, then 2120, 2135, 2150 can come. Stop Loss on every long trade is 2085. If you want to a very safe trade, then you will have to wait for 2135 to be crossed on closing basis. The Stop loss on those trades would be 2120.