Emini Futures Trading Update – 18Mar2016

sp500-emini-futures-weekly-chart-18mar2016

S&P500 Technical Analysis – for Week of 18 March 2016

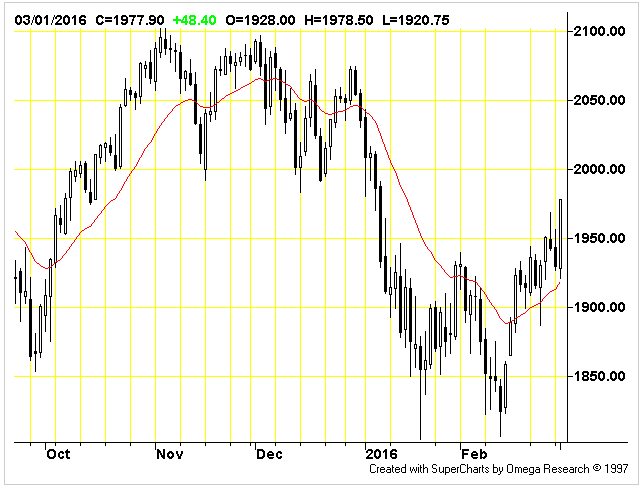
The above weekly chart of S&P500 Emini Futures indicates a triple bottom at 1850, and hence a strong bounce back, which has the strength to go all the way till 2100. We have got 5 green weeks back to back, which is one of the most powerful rallies in recent years. Above 2100, the market opinion will be very divided, and there will be enough people willing to short, and any further advances above 2100 will need good support from strong corporate earnings and global macroeconomics data.

Moving Average Indicator: The market is very BULLISH. Everything in this indicator is pointing to higher prices: the fast average is above the slow average; the fast average is on an upward slope from the previous bar; the slow average is on an upward slope from the previous bar; and price is above the fast average and the slow average. Market trend is UP as long as the S&P500 index is above 2000 level.

Momentum Indicator: Momentum (138) is way above zero, indicating an overbought market. The long term trend, based on a 45 bar moving average, is DOWN. The short term trend, based on a 9 bar moving average, is UP. Momentum is indicating an overbought market. However the market may continue to become more overbought. Look for further evidence of weakness before getting bearish here. Momentum is likely to increase above 2050 on S&P500 index. So avoid short positions above 2050. Continue reading

Emini Futures Trading Update – 01Mar2016

Hello Folks, the futures closed Feb 29 at 1929 but there are likely to open higher today on March 1st. We had no trade on the last day of Feb. We shall start March from today. Global markets are positive and we had good gains in Asia today.

On the S&P500 futures, there is support at 1930-1940 levels, which can help the futures move up towards 1970 level. In fact our last successful trade was from 1950 to 1968. So this zone has been tested by the market, and once market conditions are suitable, 1970 will be crossed. As of now, the major resistance is around 1990-2000 level. However, the base built over last 2 months (Jan, Feb 2016) can help in going higher IF global market conditions are positive. sp500-emini-futures-daily-chart-01mar2016

This is election year in the US, and we should be prepared to hear high decibel messages, and ongoing references to banking and healthcare industry. There is no new trade as of now, and we will send an update after the US markets start. Thanks.

Performance Summary – Feb 2016

Performance summary for Feb 2016:
Trade#1: -12 points (two stops of 6 points each)
Trade#2: +20 points (-10 points stop followed by +30 points gain)
Trade#3: +18 points (large traders made 28 points on this trade)
———————————————-
Total: +26 points
———————————————-

Performance Summary – Jan 2016

Performance summary for Jan 2016:
Trade#1: 0 points (trade did not start trigger price did not come)
Trade#2: -12 points (stop loss hit, trade abandoned)
Trade#3: +20 points (large traders made 30 points on this trade)
Trade#4: +25 points (-10 points stop loss followed by +35 points gain)
———————————————
Total: +33 points
———————————————

S&P500 Emini Futures Trading Update- 19Jan2016

Date: Jan 19, 2016 | 09:45 am US EST, New York.
Hello Folks, good morning. A long weekend break has helped to calm down the market’s nerves, and Asian markets did well, and European markets (CAC, DAX) are in bright green with 2% gains, so the global market sentiment is recovering from extreme bearish mood. However, we can’t say whether sentiment will recover fully or get bearish again after 2-3 days. We will let the S&P500 index decide that for us. For now, the S&P500 is underperforming the other markets with weaker gains off the start. We can expect something better from current levels.

The futures are currently at 1888. The next buy signal will come above 1895, and we can aim for 10-20 points from there. Traders can aim to buy the futures above 1896 with 8-10 point stop, and target gain of 20-25 points. A clear and stronger buy signal will come at 1919 in futures. So one can go long on S&P500 Emini Futures above 1920 for targets of 1943-1947.

Afternoon Update: 1:30 pm US EST, New York.
The futures are currently at 1875. They have given up the gains from the gap up opening in the morning.
After my previous message in the morning, the futures went up till 1894.50 and fell back, while our first buying trigger would have come at 1895, and buying order was set at 1896. So it came very close to triggering our buy order, which would have resulted in hitting a stop loss. So we have saved money today with our analysis and suitable placement of orders.

The selling momentum has reduced and CBOE Put/Call Ratio is indicating that we maybe near a reversal move, which can take the S&P500 to about 1970-1980 levels before next major resistance comes. We will wait for the suitable buying triggers to come, taking one step at a time.