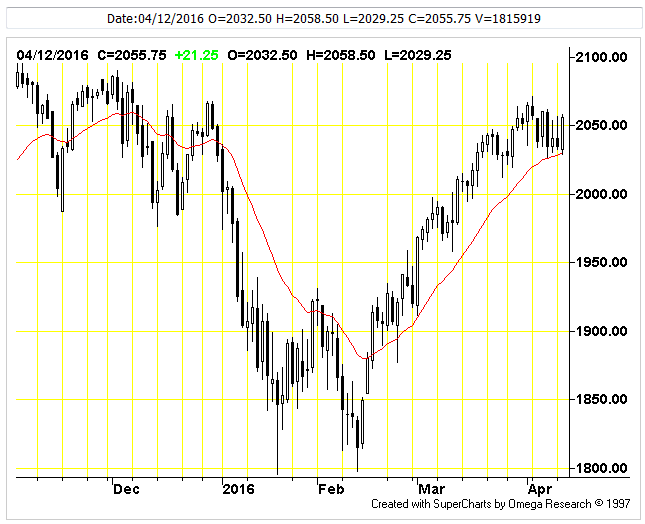
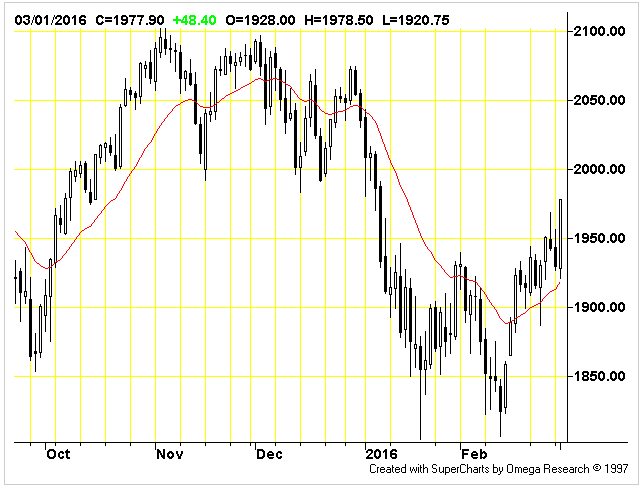
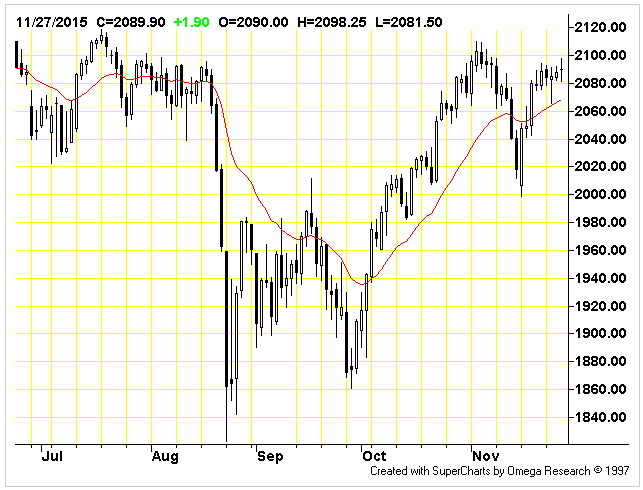
Technical Analysis of S&P500 Index Futures
RSI Indicator: RSI is in neutral territory. (RSI is at 60.57). This indicator issues buy signals when the RSI line dips below the bottom line into the oversold zone; a sell signal is generated when the RSI rises above the top line into the overbought zone. RSI is somewhat overbought (RSI is at 60.57). However, this by itself isn’t a strong enough indication to signal a trade. Look for additional evidence before getting bearish.
CCI Indicator: CCI (57.58) is in neutral territory. A signal is generated only when the CCI crosses above or below the neutral center region. CCI often misses the early part of a new move because of the large amount of time spent out of the market in the neutral region. Initiating signals when CCI crosses zero, rather than waiting for CCI to cross out of the neutral region can often help overcome this. Given this interpretation, CCI (57.58) is currently long. The current long position position will be reversed when the CCI crosses below zero. Continue reading


