Emini Futures Trading Analysis- 30Dec2019

Hello Folks, the S&P500 futures are at 3228.50
Today’s Range (so far): 3217.50 – 3244.25

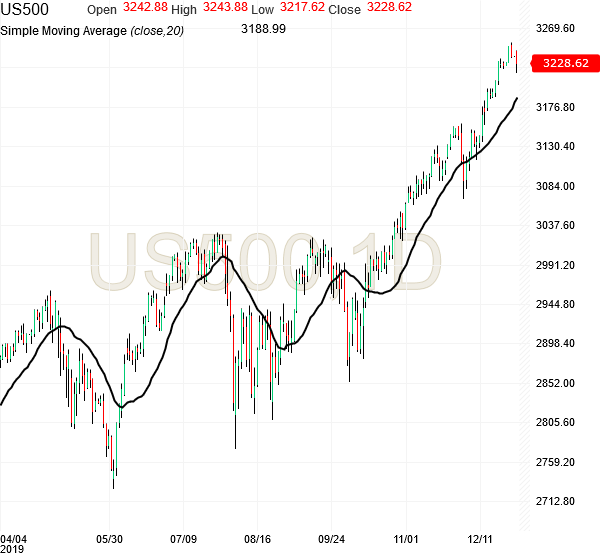
For the last 10 days, we have been seeing weakness in momentum indicators, while price was moving up, and that was not a reliable setup at all. Since 27th Dec 2019, the futures hit a high of 3553 and started correcting, in line with the weakness in short term daily momentum.

sp500-daily-chart-analysis-30dec2019

In the daily chart below, we have we can see that the 20 day moving average has not been tested in a while now, so there probably at testing of that support level coming up in the next 1-2 weeks. If it holds, we will see next leg of the rally, and if it fails, where we may see correction till 3100 level. We have to be cautious below the 20 day moving average.

sp500-daily-chart-analysis1-30dec2019

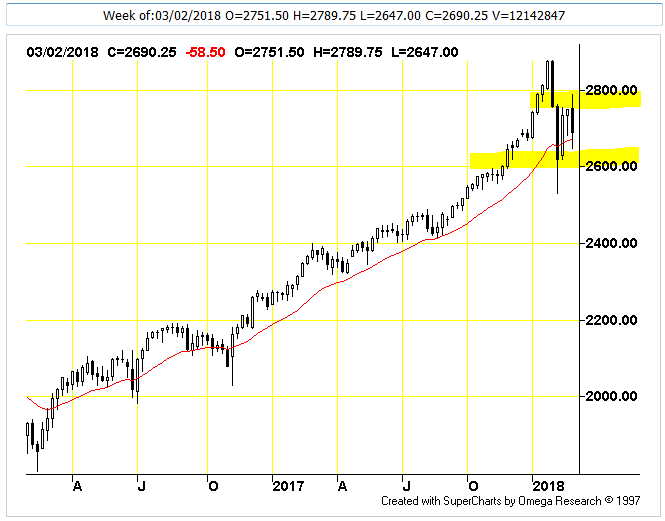
But today is 30th Dec 2019, and we have far more important things at hand!! Unless we have a 50-100 points move tomorrow on 31st Dec 2019, the following yearly chart of S&P500 index will look the same at the end of year 2019. This is a very valuable chart, because it gets drawn only once per year, at the year end! So please save this post.

sp500-yearly-chart-analysis1-30dec2019

S&P500 Futures Technical Analysis – on Yearly chart:

  • The above chart has trend line analysis of the S&P500 index yearly chart, and we see a strong band of support between 2600-2800, which should provide support during any major sell off, if it happens.
  • The two white arrows indicate the two important support levels for year 2020, and they are: 3000 and 2700.
    • 3000 is the anchor for the current upmove, and please remember that 3020 acted as a major resistance for several months, and now that is a major support. Regular market weakness will not be able to break 3000 level.
    • 2700 is the dire straits, deep low for the S&P500 for year 2020. 2740 is a major support level. It may not come at all. If it comes, it must be used for buying with a reasonable stop loss.
  • The battleground in year 2020 will be between 2900-3000 level, because if that zone is defended successfully, then new highs can come high reliability and without a sell off at the new higher levels.
  • Below 3000, the futures will search for support and we will see big swings and higher volatility, like what we saw in May 2019 around 2700 level, and Aug 2019 around 2800 level.
  • 3000 is the most important level for 2020. It is likely to get tested at least once, if not a couple of times. Above 3000, the S&P500 is in strong uptrend.
    • 3370 is upside Target#1 for 2020. It will come for sure, maybe within Q1,2020.
    • 3480 is upside Target#2 for 2020. It will come for sure. Whether it comes without a correction to 3000, or after a correction to 3000, is not clear yet.
    • 3600 is upside Target#3 for 2020. The path for this target is not clear yet. We will deal with it in real time.

Our S&P500 Emini Futures Trading Strategy for year 2020 is to constantly look for long trades – those are the winning trades, and the market has rewarded our view again and again! Our default trading strategy will be stay long above 3000 level, with a 20 point stop loss at 2980. This trade worked multiple times in year 2019 as well.

Overall, we can expect a green year in 2020, given the quality of the yearly setup. Because 2020 is also US Presidential Election Year, lots of noise will be there, and it can create volatility during the year. We should use such corrections to buy.

Please remember that America is much much bigger than any individual or group of individuals. The enterprising and hard working nature of American people (and also the bright people worldwide, because about 50 percent of S&P500 sales and income are now coming from outside the USA) is at the core of the S&P500 index rally over last 60 years. The growth of S&P500 is not dependent on anyone, and its growth can not be stopped, even if it’s blocked with hurdles briefly. It is important to remember this point even more during a market downturn, than during a nice green rally. I have learned over the last 15 years that we get best trading results by just focusing on the price action of S&P500 futures (daily and weekly charts), rather than business news media -because they have no commitment to get you profits, but I have. Hence this post!

Even if you are not a member/subscriber of our Trading Group, you can still benefit from the regular posts with S&P500 futures analysis, market direction, and bonus trades, which are published often, to help everyone visiting our website. Thanks.
Wishing you Happy New Year 2020!

Emini Futures Trading Update- 24Apr2018

spx500-futures-daily-chart-analysis2-24apr2018

Hello Folks, the S&P500 Emini futures are at 2635.75
Today’s Range: 2616.25 – 2688.50

The futures tried to cross 2680 (the known resistance level) but failed, and a series of supports broke, mainly 2650 and 2630, with cascading stop losses. The market is talking about the weakness in FAANG stocks, but it could have been something else too. The set up was getting weak below 2680.

Please refer my mail from last Friday: “The futures may test both 2650 and 2690 in the coming week. The support at 2600 should hold.” Today 2650 was broken but 2600 has held. The probability of 2600 level breaking is low, and even if it breaks, the futures may bounce back within an hour. So we can continue to work with 2600 level as the absolute stop loss.

Traders with 5-10 contracts:
Here is a new optional trade that can be done with 1-2 contracts.
“Buy at 2630 for Target 2666 with Stop loss 2600”

The futures have now lost 80 points from the 2712 level, where we first saw weakness creep in on a bullish set up. We will do a new trade once market stabilizes. Thanks.

Emini Futures Trading Update- 11Apr2018

Hello Folks, the S&P500 Emini futures are at 2653.00
Today’s Range: 2626.00 – 2661.25

The futures have been volatile so far this week, moving up down 30-40 points rapidly, and such moves will break any trading set up. So our decision to wait and watch is proving right as of now.

The futures are back above 2650 currently after an intraday fall to 2626, which is a positive sign. They have been testing 2630-2640 support level everyday this week, and if that testing is completed successfully, we can see an upmove to 2680-2700. Reliable trades will be possible above 2680.

In the last few weeks, the S&P500 has been facing sharp knee jerk selling of 30-40 points suddenly during the day, or after market hours. That is not a regular feature, so we have to wait for some more time for the S&P500 to give a double confirmation on the upmove. The down move is mostly locked out at 2600, which is also the 200 day SMA. Continue reading

Emini Futures Trading Analysis- 05Mar2018

spx500-futures-daily-chart-analysis-2681-05mar2018

The futures are on the defensive at 2681, being below 20 day SMA, but they have the support of a good defense done at 2650 level just 2 days back. So the current move at 2670-2680 maybe seen as support level testing. The sharp cut will come below 2650, so all long positions should have 2650 as the Stop loss. Long positions can be maintained above 2650 for target 2730. A reliable long trade will come above 2710.

[Bonus Trade] Buy S&P500 Emini Futures at 2680 for Target 2700 with Stop loss 2660.
That’s 20 points gain with 20 point stop loss.

Emini Futures Trading Analysis- 02Mar2018

spx500-futures-weekly-chart-analysis-02mar2018

The futures have bounced back from 2650 this week, and closed above 2673, which is the 20 week SMA. There is clear resistance at 2780 level. The futures are testing lower level support levels of 2600-2650 and recovering from those levels, which is a positive sign. The S&P500 Emini Futures have shown support at 2650 and resistance at 2780 – that’s the trading range for coming week. Many technical indicators are saying that this fall is over, and the market will now prepare for the next upmove towards new highs of 2900-2950 in the coming weeks/months. However, 2600-2650 maybe retested and 2500 can also come if 2600 breaks down. Therefore, any major long positions should be created above 2700 with 2680 as stop loss.

[Bonus Trade] Buy S&P500 Emini Futures at 2670 for Target 2710 with Stop loss 2650.
That’s 40 points gain with 20 point stop loss.

S&500 Futures Weekly Chart – Technical Analysis
Date: Friday, March 02, 2018

Moving Average Indicator: Price is above the moving average so the trend is up. In the short term, the market is bearish because the fast moving average is below the slow moving average. Even though based on conventional interpretation the market is technically bearish, we will not classify it as extremely bearish until the following occurs: the slow moving average slope is down from previous bar. In the long term, the market is bullish because the fast moving average is above the slow moving average. Even though based on conventional interpretation the market is technically bullish, we will not classify it as extremely bullish until the following occurs: price goes above the fast moving average, price goes above the slow moving average.

Bollinger Bands Indicator: The Bollinger Bands are indicating an oversold condition. An oversold reading occurs when the close is nearer to the bottom band than the top band. Volatility appears to be declining, as evidenced by a decreasing distance between the upper and lower bands over the last few bars. The market appears oversold, but may continue to become more oversold before reversing. Look for some price strength before taking any bullish positions based on this indicator.

Commodity Channel Index (CCI) Indicator: CCI (33) is in neutral territory. A signal is generated only when the CCI crosses above or below the neutral center region. CCI often misses the early part of a new move because of the large amount of time spent out of the market in the neutral region. Initiating signals when CCI crosses zero, rather than waiting for CCI to cross out of the neutral region can often help overcome this. Given this interpretation, CCI (33) is bullish, but has begun showing some weakness. Begin looking for an attractive point to liquidate long positions and return to the sidelines.

RSI Indicator: RSI (54) is in neutral territory. This indicator issues buy signals when the RSI line dips below the bottom line into the oversold zone; a sell signal is generated when the RSI rises above the top line into the overbought zone. RSI is somewhat overbought (RSI is at 54). However, this by itself isn’t a strong enough indication to signal a trade. Look for additional evidence before getting too bearish here.

MACD Indicator: MACD is in bearish territory, but has not issued a signal here. MACD generates a signal when the FastMA crosses above or below the SlowMA. The long term trend, based on a 45 bar moving average, is UP. The short term trend, based on a 9 bar moving average, is DOWN. MACD is in bearish territory.

Slow Stochastic Indicator: The stochastic is bearish because the SlowK line is below the SlowD line. The long term trend is UP. A good upward move is possible without SlowK being overbought. However, a down move in SlowK for this bar is a little concerning short term.

Disclaimer: The above analysis is meant solely for the understanding of technical analysis of the S&P500 index futures. It is not meant to provide any investment advice.