Emini SP500 Futures Trading Analysis- 15May2025

Hello Folks, here’s the latest technical analysis of Emini S&P 500 Futures (ES) based on hourly, daily, and weekly charts:

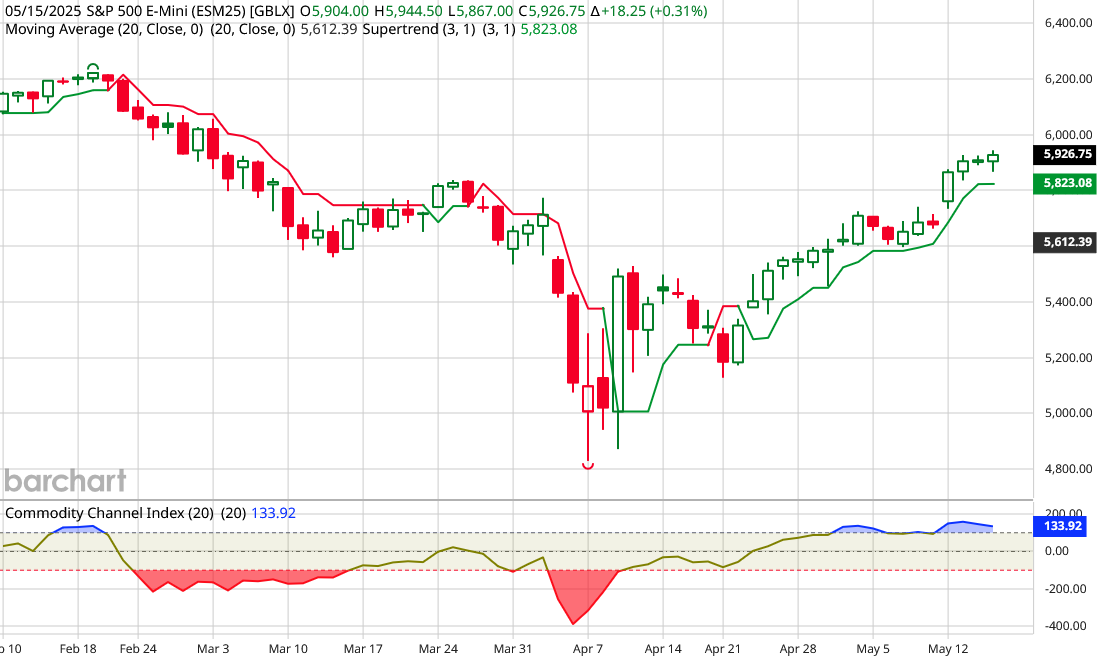
The current market price of S&P 500 E-mini Futures is 5,930.
The futures have gained more than 1000 points from their April lows of 4,850.
Please Note: The symbol for Emini S&P 500 Futures (ES) on Tradingview is ES1!

Hourly Chart Analysis:
– The ES chart shows a strong support at 5680, indicating strong buyer interest.
– A potential long trade setup is identified with favorable risk-reward dynamics.
– Traders are advised to watch for intraday levels and potential trade setups.

Daily Chart Analysis:
– S&P500 futures are trading with a bullish bias, influenced by US-China trade talks.
– Current upside target is 6000, which is about 70 points above current price, with a possible continuation of the upward movement.
– Above 6000, there can be a sharp upside rally, with price target is 6400.

Bonus Trade (yet to be triggered):
Stay long above 6000 for target 6400.

Weekly Chart Analysis:
– The main trend is upside, with clear technical patterns and signals.
– Fibonacci analysis indicates potential retracement or extension levels, while trendlines show a strong upside trend.

Technical Indicators:
– CCI is clearly in the buy zone, favoring a long position. The technical rating is “buy” based on various indicators, but market conditions can change quickly around 6000 level on profit taking. Traders must expect volatility near 6000 level.
– Moving averages and MACD-Histogram can be used to identify trends and momentum. Traders should also watch for support and resistance levels, such as 5710, which is acting as short-term resistance.

Emini Futures Trading Analysis- 10Aug2022

The S&P500 Emini Futures have been moving up in recent weeks, and taking regular support at their 10 day SMA. So the near term trend is up but there is a strong resistance between 4150-4200 level, which has already played out in May-June 2022.

The current setup with falling momentum indicator (CCI) is not suitable for long trades, and we urge all traders to reduce or exit their long trades.

S&P500 Futures Resistance Levels are at 4150 and 4200.
Above 4200 closing, 4400 target become on again.

S&P500 Futures Support Levels are at 3950 and 3750, and these levels can be used for buying for 50-100 point gains. However, a clean long trade will come above 4700.

Bonus Trade:
Buy S&P Emini Futures at 4160 for target 4200, with stop 4140.
Please trade with small position size.

Market Update (end of day): There was a big upmove in the S&P500 Futures today based on some positive news of falling inflation, which can enable the US Fed to raise interest rates less rapidly, or maybe even pause for a while. The above bonus trade was completed successfully, giving 40 points gain. The momentum indicator (CCI) is still not looking very bullish, so one has to trade on the long side with small position size.

Emini Futures Trading Analysis- 17Jan2022

The S&P500 Emini Futures have been trading below their trend line for the last several weeks, and their recent attempt to break out above the trendline (at 4780 level) failed during end-Dec 2021 and early Jan 2022.

S&P500 Futures Resistance Levels are at 4720 and 4780. Above 4720 closing, 4800 target become on again.

S&P500 Futures Support Levels are at 4650 and 4600, and these levels can be used for buying for 30-50 point gains. However, a clean long trade will come above 4700.

Bonus Trade:
Buy at 4720 for Target 4780 with Stop 4690.

Emini Futures Trading Analysis- 16Dec2021

Please see this image for S&P500 futures daily chart analysis.

S&P500 Futures have been facing major resistance at 4700 level and have not been able to stay above 4720 for much time, and have been facing major selling pressure above 4700-4720 level, which is now the main Resistance Level. Because this level has become such a big resistance for a long time, whenever it breaks, there will be at least 100-150 point upside rally till 4850 level. A closing above 4720 can be considered a decisive breakout, with target 4830. That upmove can be rapid.

On the lower side, 4500 level is a strong support, and it will present a good buying opportunity. For now, we have to remain cautious again, and see if 4600 support level holds. There is no clean or safe trade in the current market, and we will do a fresh analysis tomorrow. Thanks.