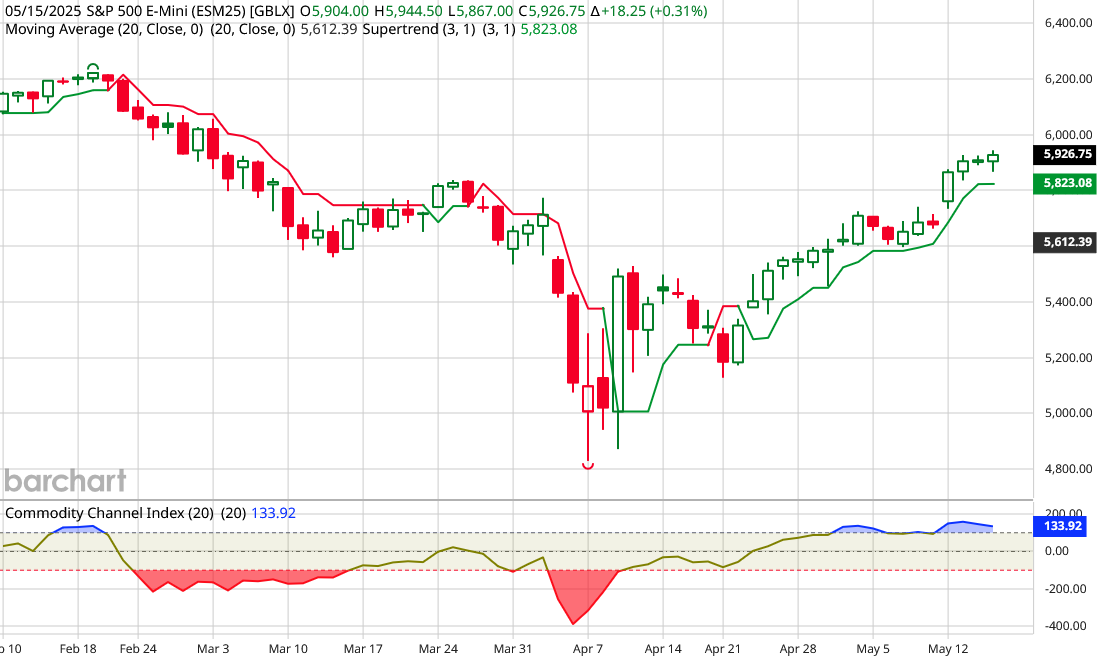
Hello Folks, here’s the latest technical analysis of Emini S&P 500 Futures (ES) based on hourly, daily, and weekly charts:
The current market price of S&P 500 E-mini Futures is 5,930.
The futures have gained more than 1000 points from their April lows of 4,850.
Please Note: The symbol for Emini S&P 500 Futures (ES) on Tradingview is ES1!
Hourly Chart Analysis:
– The ES chart shows a strong support at 5680, indicating strong buyer interest.
– A potential long trade setup is identified with favorable risk-reward dynamics.
– Traders are advised to watch for intraday levels and potential trade setups.
Daily Chart Analysis:
– S&P500 futures are trading with a bullish bias, influenced by US-China trade talks.
– Current upside target is 6000, which is about 70 points above current price, with a possible continuation of the upward movement.
– Above 6000, there can be a sharp upside rally, with price target is 6400.
Bonus Trade (yet to be triggered):
Stay long above 6000 for target 6400.
Weekly Chart Analysis:
– The main trend is upside, with clear technical patterns and signals.
– Fibonacci analysis indicates potential retracement or extension levels, while trendlines show a strong upside trend.
Technical Indicators:
– CCI is clearly in the buy zone, favoring a long position. The technical rating is “buy” based on various indicators, but market conditions can change quickly around 6000 level on profit taking. Traders must expect volatility near 6000 level.
– Moving averages and MACD-Histogram can be used to identify trends and momentum. Traders should also watch for support and resistance levels, such as 5710, which is acting as short-term resistance.


